


JETRO Invest Japan Report 2024
Chapter2. Trends in Inward FDI to Japan Section3. Trends in Inward FDI to Japan by Industry
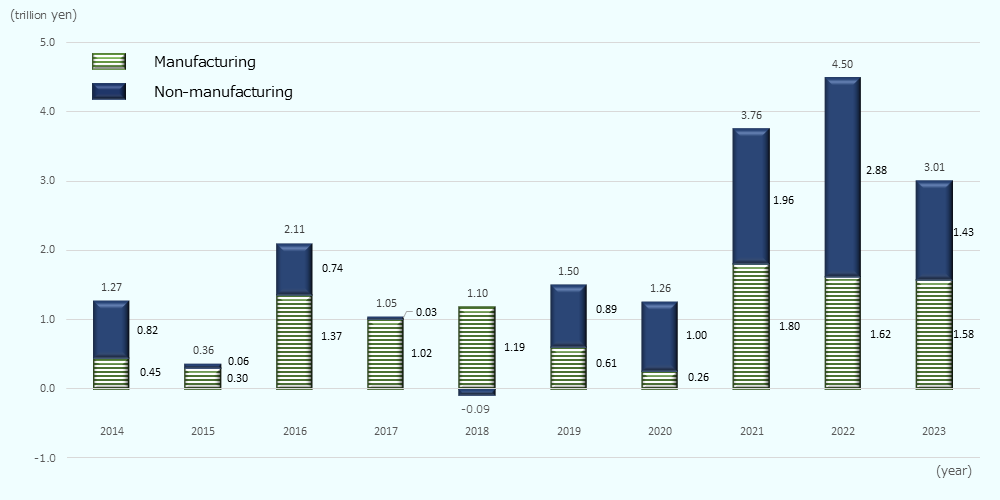
1. Flow
Large decline in non-manufacturing sector, especially in communications and transportation
The overall amount of inward FDI to Japan in 2023 (directional principle) was 3.0 trillion yen (down 33.0% from the previous year). By major industry sector, the manufacturing sector accounted for 1.6 trillion yen (down 2.0% from the previous year), while the non-manufacturing sector accounted for 1.4 trillion yen (down 50.4%), indicating a large decrease in the non-manufacturing sector. Looking at the decline in investment in the non-manufacturing sector at the industry level, the main factors for the decline are decreases of approximately 500 billion yen in the transportation industry (which was 700.4 billion yen in the previous year), approximately 460 billion yen in the communications industry (503.3 billion yen in the previous year), and approximately 400 billion yen in the finance and insurance industry (1,157.4 billion yen in the previous year), respectively.
Looking at the FDI amounts of top 10 industries, although the decline was large, the finance and insurance industry remained first with 700 billion yen (down 35.3% from the previous year). Precision machinery showed a remarkable increase of about 60 times.
-
Note:
This is based on the directional principle and different from that of the statistics by country/region (asset and liability principle).
-
Source:
Based on "Balance of Payments" by MOF and BOJ
| Ranking | Sector | 2023 |
2023 Growth rate (YoY) |
Share |
|---|---|---|---|---|
| 1 | Finance and insurance | 7,493 | -35.3 | 24.9 |
| 2 | Electric machinery | 4,935 | 26.7 | 16.4 |
| 3 | Chemicals and pharmaceuticals | 4,933 | 10.3 | 16.4 |
| 4 | Wholesale and retail | 4,394 | 287.0 | 14.6 |
| 5 | Transportation equipment | 2,560 | -20.4 | 8.5 |
| 6 | Precision machinery | 2,427 | 5,542.8 | 8.1 |
| 7 | Transportation | 1,975 | -71.8 | 6.6 |
| 8 | General machinery | 445 | -51.4 | 1.5 |
| 9 | Communications | 426 | -91.5 | 1.4 |
| 10 | Real estate | 295 | * | 1.0 |
| — | Mining | -108 | — | — |
| — | Construction | -160 | — | — |
| — | Total | 30,112 | -33.0 | — |
-
Note:
Directional principle. Some industries are net withdrawal.
The marks of * in the chart show that the investment in 2022 is negative due to net withdrawal and therefore growth rate is not applicable. -
Source:
Based on "Balance of Payments" by MOF and BOJ
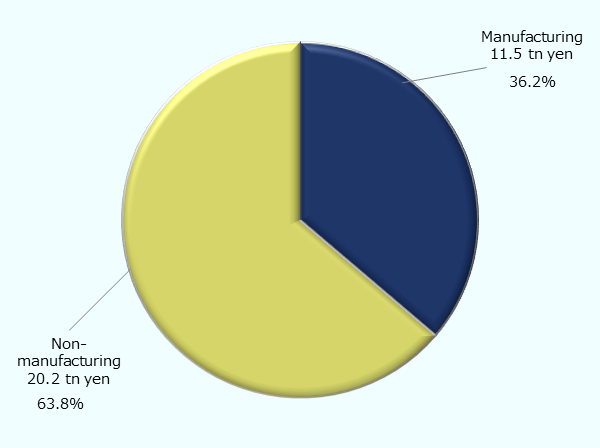
2. Stock
Finance and insurance continues to be the largest industry, accounting for approximately 40% of the total
The total FDI stock in Japan (directional principle) at the end of 2023 was 31.7 trillion yen (up 5.3% from the previous year), and by major industry sector, the manufacturing sector accounted for 11.5 trillion yen (up 12.0%, and 36.2% of the total), while the non-manufacturing sector accounted for 20.2 trillion yen (up 1.8%, and 63.8% of the total). Looking at detailed industries, the finance and insurance industry was the largest, down 2.3% from the previous year to 11.5 trillion yen (36.3% of the total), followed by chemicals and pharmaceuticals, up 8.7% to 3.19 trillion yen (10.1% ), and transportation, up 3.5% to 3.17 trillion yen (10.0%). The notable growth rate was in wholesale and retail, at 0.6 trillion yen (up 145.0% from the previous year), with the United States seeing the largest increase.
Source: Based on "International Investment Position of Japan" by MOF and BOJ
| Ranking | Sector | Stock | Growth rate (YoY) | Share |
|---|---|---|---|---|
| 1 | Finance and insurance | 115,213 | -2.3 | 36.3 |
| 2 | Chemicals and pharmaceuticals | 31,900 | 8.7 | 10.1 |
| 3 | Transportation equipment | 31,744 | 3.5 | 10.0 |
| 4 | Electric machinery | 26,992 | 19.4 | 8.5 |
| 5 | Communications | 25,398 | 12.7 | 8.0 |
| 6 | Services | 14,534 | -10.3 | 4.6 |
| 7 | Transportation | 13,658 | 10.2 | 4.3 |
| 8 | Wholesale and retail | 6,098 | 145.0 | 1.9 |
| 9 | General machinery | 5,894 | 2.5 | 1.9 |
| 10 | Real estate | 5,571 | 10.3 | 1.8 |
| ― | Others | 40,166 | 10.8 | 12.7 |
| ― | Total | 317,168 | 5.3 | 100.0 |
-
Source:
Based on "International Investment Position of Japan" by MOF and BOJ
JETRO Invest Japan Report 2024
-
Section1.
-
Section2.
-
Section3.
-
Section1.
-
Section2.
-
Section3.
-
Section4.
-
[Column]
-
[Column]
-
Section5.
-
[Column]
-
Section6.
-
[Column]
-
Section1.
-
Section2.
-
Section3.
-
Section4.
Laws and Regulations on Setting Up Business in Japan Pamphlet
The pamphlet "Laws & Regulations" is available in PDF, and outlines basic information about laws, regulations and procedures related to setting up a business in Japan. It is available in English and Japanese. You can download via the "Request Form" button below.
Contact Us
Investing in and collaborating with Japan
We will do our very best to support your business expansion into and within Japan as well as business collaboration with Japanese companies. Please feel free to contact us via the form below for any inquiries.
Inquiry FormJETRO Worldwide
Our network covers over 50 countries worldwide. You can contact us at one of our local offices near you for consultation.
Worldwide Offices