


JETRO Invest Japan Report 2024
Chapter2. Trends in Inward FDI to Japan Section2. Trends in Inward FDI to Japan by Country/Region
1. Flow
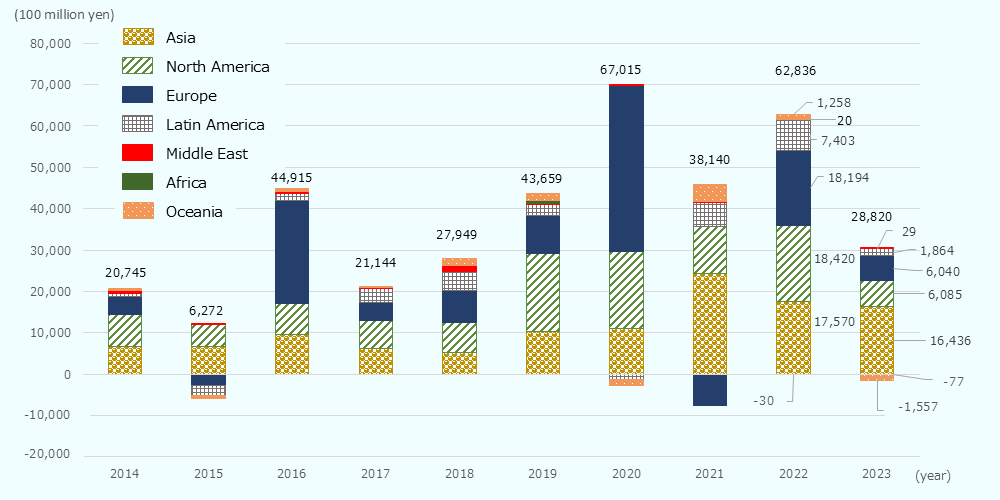
Asia returns as the largest investment source region due to significant contraction in Europe and the U.S. and growth in China and Korea
Looking at the FDI flow to Japan in 2023 (asset and liability principle) by region, Asia was the largest at 1.6 trillion yen (down 6.5% from the previous year), followed by North America, which fell sharply to 0.6 trillion yen (down 54.7%). Europe declined significantly, as was the case in North America. Asia had the highest amount, with Singapore at 0.8 trillion yen, accounting for more than half of the total in Asia, and the highest among the world's countries and regions. Among Asian countries with high year-on-year growth rates, China was the highest at 0.2 trillion yen (up 103.8% from the previous year), followed by Taiwan at 0.3 trillion yen (up 47.5%). The United States, which was ranked first in the previous year, dropped to second place with 0.6 trillion yen (down 54.7%). In Europe, France and the United Kingdom saw opposite trends in year-on-year growth rates, but the investment amounts were roughly at the same level.
-
Source:
Based on "Balance of Payments" by MOF and BOJ
| Ranking |
Investor Country/Region |
2023 |
2023 Growth rate (YoY) |
2023 Share |
|---|---|---|---|---|
| 1 | Singapore | 8,385 | -3.1 | 29.1 |
| 2 | United States | 5,564 | -54.7 | 19.3 |
| 3 | France | 3,907 | 86.1 | 13.6 |
| 4 | United Kingdom | 3,591 | -68.1 | 12.5 |
| 5 | Taiwan | 2,708 | 47.5 | 9.4 |
| 6 | Hong Kong | 2,201 | -41.9 | 7.6 |
| 7 | China | 1,789 | 103.8 | 6.2 |
| 8 | Korea | 1,280 | 13.3 | 4.4 |
| 9 | Cayman Islands | 920 | -86.1 | 3.2 |
| 10 | Luxembourg | 546 | 192.0 | 1.9 |
| — | World | 28,820 | -54.1 | 100.0 |
-
Source:
Based on "Balance of Payments" by MOF and BOJ
2. Stock
The United States ranks first, while France surpasses the Netherlands to take fourth place
As for the FDI stock in Japan (asset and liability principle) by region at the end of 2023, Europe accounted for the largest at 20.8 trillion yen (41.3% of the total), followed by North America at 13.4 trillion yen (26.5%) and Asia at 11.9 trillion yen (23.6%). By country, the United States accounted for the largest, same as last year, at 12.5 trillion yen (24.7% of the total), followed by the United Kingdom at 8.7 trillion yen (17.2%) and Singapore at 5.3 trillion yen (10.4%). France, which ranked fifth in the previous year, increased slightly to 3.4 trillion yen (3.2 trillion yen in the previous year), while the Netherlands, which ranked fourth in the previous year, decreased slightly to 3.3 trillion yen (3.4 trillion yen in the previous year). Therefore, their rankings were switched. The top 10 countries and regions accounted for 85.8% of the total FDI stock in Japan.
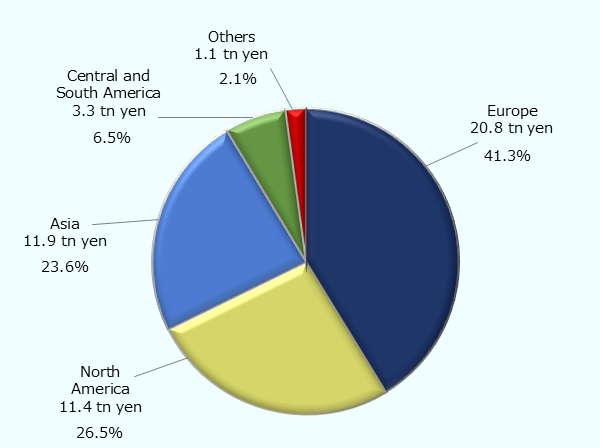
Note: Source: Based on "International Investment Position of Japan" by MOF and BOJ
| Ranking | Country/Region | Stock | Growth rate (YoY) | Ratio |
|---|---|---|---|---|
| 1 | United States | 124,655 | 23.2 | 24.7 |
| 2 | United Kingdom | 86,989 | 11.3 | 17.2 |
| 3 | Singapore | 52,614 | 8.1 | 10.4 |
| 4 | France | 34,107 | 4.5 | 6.8 |
| 5 | Netherlands | 32,542 | -4.6 | 6.4 |
| 6 | Hong Kong | 27,608 | 5.3 | 5.5 |
| 7 | Cayman Islands | 27,073 | 6.7 | 5.4 |
| 8 | Switzerland | 20,737 | -4.4 | 4.1 |
| 9 | Germany | 14,015 | 1.3 | 2.8 |
| 10 | Taiwan | 12,993 | 21.1 | 2.6 |
| — | Others | 71,843 | 3.1 | 14.2 |
| — | Total | 505,176 | 9.3 | 100.0 |
-
Source:
Based on "International Investment Position of Japan" by MOF and BOJ
JETRO Invest Japan Report 2024
-
Section1.
-
Section2.
-
Section3.
-
Section1.
-
Section2.
-
Section3.
-
Section4.
-
[Column]
-
[Column]
-
Section5.
-
[Column]
-
Section6.
-
[Column]
-
Section1.
-
Section2.
-
Section3.
-
Section4.
Laws and Regulations on Setting Up Business in Japan Pamphlet
The pamphlet "Laws & Regulations" is available in PDF, and outlines basic information about laws, regulations and procedures related to setting up a business in Japan. It is available in English and Japanese. You can download via the "Request Form" button below.
Contact Us
Investing in and collaborating with Japan
We will do our very best to support your business expansion into and within Japan as well as business collaboration with Japanese companies. Please feel free to contact us via the form below for any inquiries.
Inquiry FormJETRO Worldwide
Our network covers over 50 countries worldwide. You can contact us at one of our local offices near you for consultation.
Worldwide Offices