


JETRO Invest Japan Report 2024
Chapter2. Trends in Inward FDI to Japan Section1. Trends in Inward FDI to Japan
1. Trends in Flow
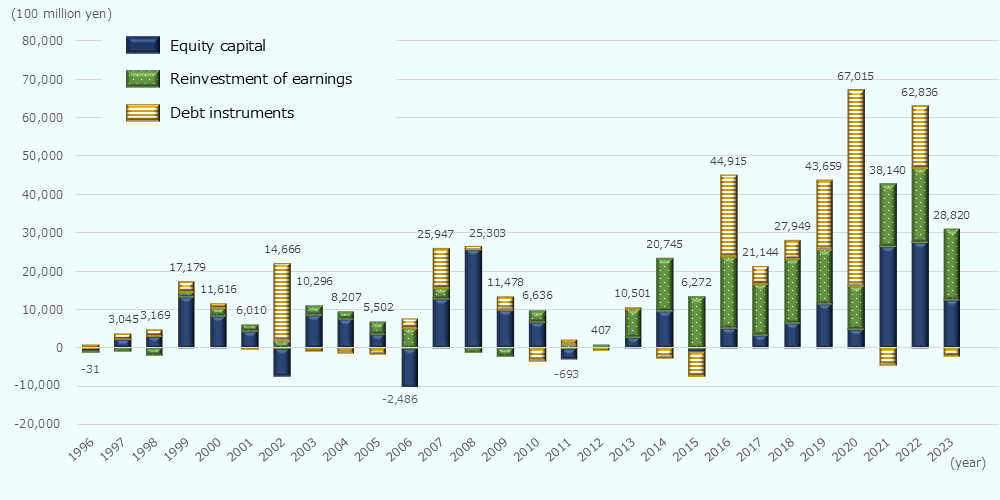
Inward FDI flows to Japan halved due to the backlash from a large increase in the previous year
According to the Balance of Payments Statistics (asset and liability principle) published by the Ministry of Finance (MOF) and the Bank of Japan (BOJ), the FDI flow to Japan in 2023 declined sharply to 2.9 trillion yen, down 54.1% from the previous year . By type of capital, equity capital decreased 54.2% from the previous year to 1.3 trillion yen, reinvestment of earnings decreased 4.0% to 1.8 trillion yen, and debt instruments decreased to minus 0.2 trillion yen from 1.6 trillion yen. Debt instruments are related to the borrowing and lending of funds between companies in a capital relationship, and the results reflect activities such as borrowing by Japanese companies from their overseas subsidiaries and affiliated companies.
-
Note:
The figures before 2013 are calculated based upon a different principle.
-
Source:
Based on "Balance of Payments" by MOF and BOJ
2. Trends in Stock
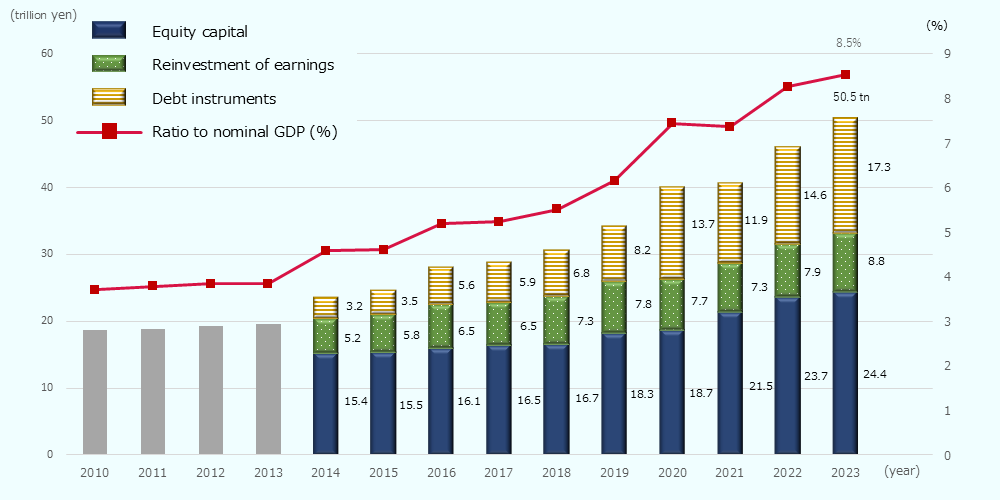
Inward FDI stock continues to rise
The FDI stock in Japan (asset and liability principle) at the end of 2023 was 50.5 trillion yen (up 9.3% from the previous year), representing 8.5% of GDP. Looking at this stock by capital type, equity capital increased 3.0% year on year to 24.4 trillion yen, reinvestment of earnings increased 11.4% to 8.8 trillion yen, and debt instruments increased 18.5% to 17.3 trillion yen. Since the breakdown of the stock began to be published in 2014, equity capital has increased significantly from 15.4 trillion yen to 24.4 trillion yen (up 58.4%), reinvestment of earnings from 5.2 trillion yen to 8.8 trillion yen (up 69.2%), and debt instruments from 3.2 trillion yen to 17.3 trillion yen (up 440.6%), respectively.
-
Note:
Breakdown of stock in 2013 and before is not disclosed.
-
Source:
Based on "International Investment Position of Japan" by MOF and BOJ and "National Accounts of Japan" by the Cabinet Office
JETRO Invest Japan Report 2024
-
Section1.
-
Section2.
-
Section3.
-
Section1.
-
Section2.
-
Section3.
-
Section4.
-
[Column]
-
[Column]
-
Section5.
-
[Column]
-
Section6.
-
[Column]
-
Section1.
-
Section2.
-
Section3.
-
Section4.
Laws and Regulations on Setting Up Business in Japan Pamphlet
The pamphlet "Laws & Regulations" is available in PDF, and outlines basic information about laws, regulations and procedures related to setting up a business in Japan. It is available in English and Japanese. You can download via the "Request Form" button below.
Contact Us
Investing in and collaborating with Japan
We will do our very best to support your business expansion into and within Japan as well as business collaboration with Japanese companies. Please feel free to contact us via the form below for any inquiries.
Inquiry FormJETRO Worldwide
Our network covers over 50 countries worldwide. You can contact us at one of our local offices near you for consultation.
Worldwide Offices