


JETRO Invest Japan Report 2025
Chapter2. Trends in Inward FDI to Japan Section3. Inward FDI to Japan by Industry
1. Net Flows
Significant decrease observed in chemicals and pharmaceuticals, and electric machinery industries
In 2024, inward FDI to Japan (net flows, the directional principle) by industry sector decreased 31.0% from the previous year to 2.0 trillion yen. By major industry category, manufacturing recorded 600 billion yen (down 58.4% year-on-year), while non-manufacturing stood at 1.5 trillion yen (down 7.8%), resulting in a sharp decline in manufacturing, reversing the trend seen in 2023 (Chart 2-7). Within the manufacturing sector, the most significant declines were seen in precision machinery, down 417.2 billion yen year-on-year; chemicals and pharmaceuticals, down 269.1 billion yen; and electric machinery, down 255.5 billion yen, resulting in a total decline of about 900 billion yen for the three industries (Chart 2-8). Looking at the leading industries, finance and insurance recorded 746.2 billion yen (down 23.2% year-on-year), communications at 434.7 billion yen (decreased by 22.9 billion yen), and services at 309.3 billion yen (minus 8.6 billion yen in 2023). The top three industries were all non-manufacturing, accounting for over 70% of the total.
![A stacked bar chart showing the transition of inward FDI amounts by major industry sector (Manufacturing, Non-manufacturing) from 2014 to 2024. The vertical axis represents the amount (in trillions of yen), ranging from −1.0 trillion to 5.0 trillion yen, and the horizontal axis represents each year. The bar chart consists of two elements: light blue indicates [Manufacturing] and dark blue indicates [Non-manufacturing.] * 2014–2017: 1.3 trillion yen in 2014. It decreased to 0.4 trillion yen in 2015 but increased to 2.1 trillion yen in 2016. It stood at 1.0 trillion yen in 2017. During this period, investments were generally well-balanced between manufacturing and non-manufacturing. * 2018–2020: Hovered in the 1 trillion yen range: 1.1 trillion yen in 2018, 1.5 trillion yen in 2019, and 1.3 trillion yen in 2020. In 2018, manufacturing was the center (1.2 trillion yen), while non-manufacturing saw a slight decrease (−0.1 trillion yen). * 2021–2022: A period of rapid investment growth. Recorded 3.8 trillion yen in 2021 (Manufacturing 1.8 trillion yen, Non-manufacturing 2.0 trillion yen). Reached a peak of 4.5 trillion yen in 2022, with non-manufacturing growing significantly to 2.9 trillion yen. * 2023–2024: Decreased to 2.9 trillion yen in 2023 and 2.0 trillion yen in 2024. In 2024, manufacturing accounted for 0.6 trillion yen and non-manufacturing for 1.5 trillion yen, indicating that non-manufacturing accounted for the majority of the investment. Overall, it visually demonstrates a trend where the investment scale has expanded since 2021, and investments by the non-manufacturing sector have been driving the overall total, particularly in the most recent years.](/ext_images/en/invest/img/investment_environment/ijre/report2025/ch2/2-7_rev.png)
-
Note:
This is based on the directional principle and different from that of the statistics by country/region (the asset/liability principle).
-
Source:
Based on "Balance of Payments" by MOF and BOJ
| Ranking | Sector | 2024 |
2024 Growth rate (YoY) |
2024 Share |
|---|---|---|---|---|
| 1 | Finance and insurance | 7,462 | -23.2 | 36.9 |
| 2 | Communications | 4,347 | * | 21.5 |
| 3 | Services | 3,093 | * | 15.3 |
| 4 | Electric machinery | 2,579 | -49.8 | 12.8 |
| 5 | Transportation equipment | 2,385 | 78.5 | 11.8 |
| 6 | Chemicals and pharmaceuticals | 1,942 | -58.1 | 9.6 |
| 7 | Real estate | 938 | 47.2 | 4.6 |
| 8 | General machinery | 765 | 47.3 | 3.8 |
| 9 | Transportation | 575 | -9.5 | 2.8 |
| 10 | Textile | 125 | 40.9 | 0.6 |
| — | Precision machinery | -1,791 | — | — |
| — | Wholesale and retail | -3,407 | — | — |
| Total | 20,217 | -31.0 | 100.0 | |
-
Note:
Items marked with * in the table are not shown as one of the comparative data is negative.
-
Source:
Based on "Balance of Payments" by MOF and BOJ
2. Stock
Finance and insurance industry standing out at 40%
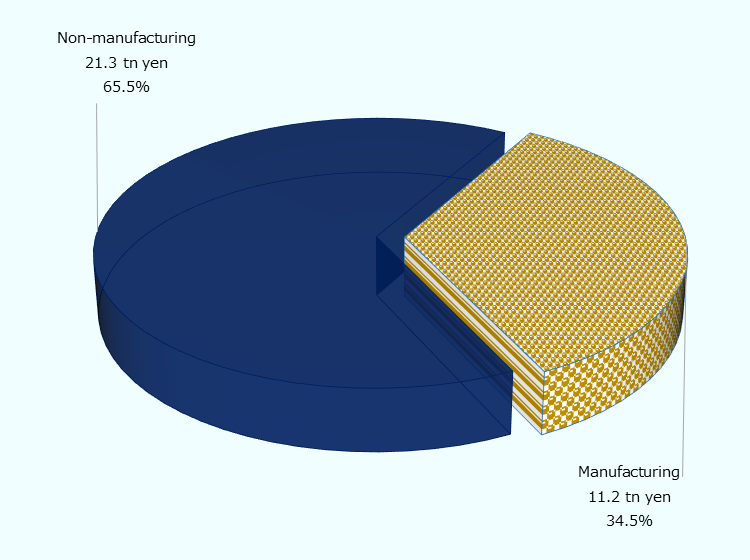
At the end of 2024, inward FDI stock in Japan by industry sector (the directional principle) totaled 32.5 trillion yen, up 2.8% from the previous year. By major industry category, manufacturing accounted for 11.2 trillion yen (down 1.3% year-on-year, 34.5% of the total), while non-manufacturing reached 21.3 trillion yen (up 5.1% year-on-year, 65.5% of the total) (Chart 2-9). Looking at details of industries, the finance and insurance industry was the largest, up 4.4% from the previous year to 12.1 trillion yen (37.1% of the total), followed by chemicals and pharmaceuticals, up 0.5% to 3.2 trillion yen (9.9% of the total), and transportation equipment, up 4.0% to 3.2 trillion yen (9.8% of the total), maintaining the same ranking as in 2023 (Chart 2-10). The industries showing the most notable growth rates were real estate (up 18.3% year-on-year) and communications (up 12.3%).
Source: Based on "International Investment Position of Japan" by MOF and BOJ
| Ranking | Sector | Stock | Growth rate (YoY) | Share |
|---|---|---|---|---|
| 1 | Finance and insurance | 120,503 | 4.4 | 37.1 |
| 2 | Chemicals and pharmaceuticals | 32,045 | 0.5 | 9.9 |
| 3 | Transportation equipment | 31,780 | 4.0 | 9.8 |
| 4 | Communications | 28,515 | 12.3 | 8.8 |
| 5 | Electric machinery | 25,626 | -5.0 | 7.9 |
| 6 | Services | 15,955 | 12.6 | 4.9 |
| 7 | Transportation | 14,089 | 3.3 | 4.3 |
| 8 | Real estate | 6,951 | 18.3 | 2.1 |
| 9 | General machinery | 6,093 | 3.4 | 1.9 |
| 10 | Glass and ceramics | 4,746 | -1.5 | 1.5 |
| ― | Others | 38,643 | -6.7 | 11.9 |
| Total | 324,946 | 2.8 | 100.0 | |
-
Source:
Based on "International Investment Position of Japan" by MOF and BOJ
JETRO Invest Japan Report 2025
-
Section1
-
Section2
-
Section3
-
Section4
-
Section1
-
Section2
-
Section3
-
Section4
-
Section5
-
Section1
-
Section2
-
Section3
Laws and Regulations on Setting Up Business in Japan Pamphlet
The pamphlet "Laws & Regulations" is available in PDF, and outlines basic information about laws, regulations and procedures related to setting up a business in Japan. It is available in English and Japanese. You can download via the "Request Form" button below.
Contact Us
Investing in and collaborating with Japan
We will do our very best to support your business expansion into and within Japan as well as business collaboration with Japanese companies. Please feel free to contact us via the form below for any inquiries.
Inquiry FormJETRO Worldwide
Our network covers over 50 countries worldwide. You can contact us at one of our local offices near you for consultation.
Worldwide Offices