


JETRO Invest Japan Report 2025
Chapter2. Trends in Inward FDI to Japan Section2. Inward FDI to Japan by Country and Region
1. Net Flows
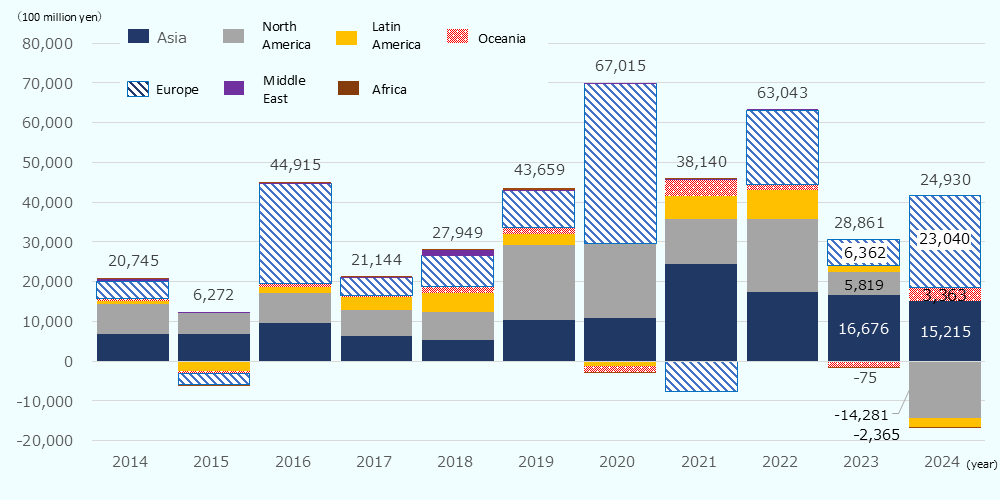
Net investment declined for the second consecutive year, primarily due to significant net withdrawals from the U.S.
Looking at the flow of FDI in Japan (the asset/liability principle) in 2024 by region, net investment inflows were recorded in Europe (2.3 trillion yen), Asia (1.5 trillion yen), and Oceania (0.3 trillion yen) (Chart 2-3). On the other hand, net withdrawals were recorded in North America (1.4 trillion yen) and in Latin America (0.2 trillion yen), resulting in a total net withdrawal of 1.7 trillion yen—the largest since the current statistical standards were adopted in 2014. By country, Switzerland recorded the highest amount at 933.8 billion yen, a sharp rebound from 700 million yen in 2023 (Chart 2-4). Meanwhile, the United States saw both execution and recovery reach record highs [Note] at 21.6 trillion yen and 23.1 trillion yen, respectively, resulting in a net withdrawal of 1.6 trillion yen. This may have been influenced by factors such as the repayment of intercompany loans (debt instruments) and the sale of Japanese subsidiaries by U.S. companies.
-
[Note]
This refers to the period from 2014 onwards, after changing to the comparable statistical standard currently in use.

-
Source:
Based on "Balance of Payments" by MOF and BOJ
| Ranking |
Investor Country/Region |
2024 |
2024 Growth rate (YoY) |
2024 Share |
|---|---|---|---|---|
| 1 | Switzerland | 9,338 | 140,824.0 | 37.5 |
| 2 | Netherlands | 7,405 | * | 29.7 |
| 3 | Hong Kong | 5,241 | 88.2 | 21.0 |
| 4 | Singapore | 4,099 | -50.0 | 16.4 |
| 5 | Australia | 3,276 | * | 13.1 |
| 6 | Taiwan | 2,480 | 5.2 | 9.9 |
| 7 | China | 2,051 | 13.6 | 8.2 |
| 8 | France | 2,043 | -35.8 | 8.2 |
| 9 | Canada | 1,332 | 145.5 | 5.3 |
| 10 | Belgium | 1,095 | 50.0 | 4.4 |
| — | United Kingdom | -1,678 | * | * |
| — | Cayman Islands | -3,237 | * | * |
| — | United States | -15,613 | * | * |
| Total | 24,930 | -13.6 | 100.0 | |
-
Note:
Items marked with * in the table are not shown as one of the comparative data is negative.
-
Source:
Based on "Balance of Payments" by MOF and BOJ
2. Stock
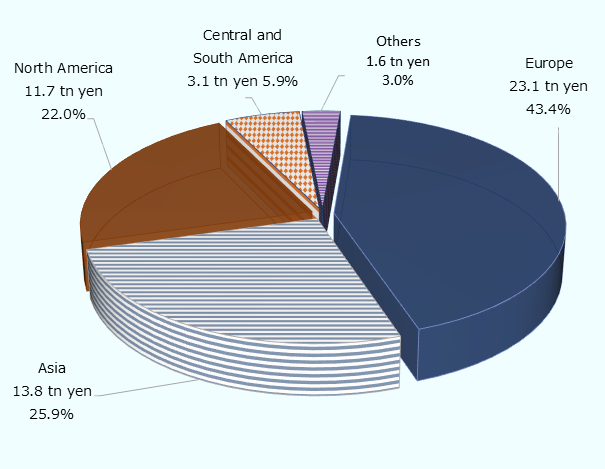
Due to substantial net withdrawals of the U.S., Asia has surpassed North America by region, rising to second place for the first time in two years
Looking at inward FDI stock in Japan (the asset/liability principle) at the end of 2024, Europe had the largest share at 23.1 trillion yen (43.4%), followed by Asia at 13.8 trillion yen (25.9%), and North America at 11.7 trillion yen (22.0%) (Chart 2-5). By country and region, as the U.S. saw its first net decrease in the stock since 2014, when this data became available, Asia surpassed North America for the first time in two years in regional ranking, although the United States still maintained the highest position at 10.6 trillion yen (20.0%) (Chart 2-6). This was followed by the United Kingdom at 9.1 trillion yen (17.0%) and Singapore at 6.1 trillion yen (11.4%) (Chart 2-6). France, which ranked fourth in 2023, saw only a slight increase from the previous year to 3.3 trillion yen, while the Netherlands, which ranked fifth last year, increased 10.9% to 3.7 trillion yen, swapping positions with France. The share of the top ten countries and regions fell slightly from 85.8% in 2023 to 83.2%.
Source: Based on "International Investment Position of Japan" by MOF and BOJ
| Ranking | Country/Region | Stock | Growth rate (YoY) | Ratio |
|---|---|---|---|---|
| 1 | United States | 106,369 | -14.3 | 20.0 |
| 2 | United Kingdom | 90,870 | 3.9 | 17.0 |
| 3 | Singapore | 60,746 | 14.6 | 11.4 |
| 4 | Netherlands | 36,931 | 10.9 | 6.9 |
| 5 | France | 33,289 | 1.0 | 6.2 |
| 6 | Hong Kong | 32,590 | 17.0 | 6.1 |
| 7 | Switzerland | 29,202 | 37.3 | 5.5 |
| 8 | Cayman Islands | 24,501 | -9.6 | 4.6 |
| 9 | Taiwan | 14,870 | 15.0 | 2.8 |
| 10 | Germany | 14,121 | 0.8 | 2.6 |
| 11 | China | 13,251 | 8.6 | 2.5 |
| 12 | Australia | 10,840 | 27.4 | 2.0 |
| 13 | Canada | 10,682 | 18.6 | 2.0 |
| 14 | Korea | 9,519 | 2.2 | 1.8 |
| 15 | Luxembourg | 8,778 | -4.6 | 1.6 |
| 16 | Thailand | 3,533 | 9.4 | 0.7 |
| 17 | Belgium | 2,953 | 61.8 | 0.6 |
| 18 | Italy | 2,101 | 17.2 | 0.4 |
| 19 | Malaysia | 1,893 | -0.1 | 0.4 |
| 20 | Spain | 1,098 | 33.5 | 0.2 |
| ― | Others | 24,855 | 36.1 | 4.7 |
| Total | 532,991 | 4.5 | 100.0 | |
-
Source:
Based on "International Investment Position of Japan" by MOF and BOJ
JETRO Invest Japan Report 2025
-
Section1
-
Section2
-
Section3
-
Section4
-
Section1
-
Section2
-
Section3
-
Section4
-
Section5
-
Section1
-
Section2
-
Section3
Laws and Regulations on Setting Up Business in Japan Pamphlet
The pamphlet "Laws & Regulations" is available in PDF, and outlines basic information about laws, regulations and procedures related to setting up a business in Japan. It is available in English and Japanese. You can download via the "Request Form" button below.
Contact Us
Investing in and collaborating with Japan
We will do our very best to support your business expansion into and within Japan as well as business collaboration with Japanese companies. Please feel free to contact us via the form below for any inquiries.
Inquiry FormJETRO Worldwide
Our network covers over 50 countries worldwide. You can contact us at one of our local offices near you for consultation.
Worldwide Offices