


JETRO Invest Japan Report 2021
Chapter2. Japan's Business Environment and Foreign-Affiliated Companies Section3. Evaluation of Japan’s Business Environment by Foreign-Affiliated Companies
Survey of Trends in Business Activities of Foreign Affiliates
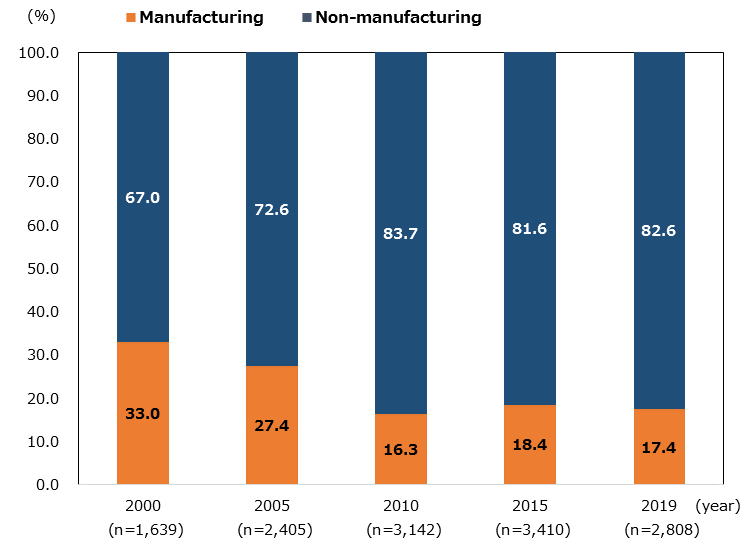
The Ministry of Economy, Trade and Industry has conducted the “Survey of Trends in Business Activities of Foreign Affiliates” (which ended in fiscal 2020), targeting companies meeting specific conditions such as the foreign ownership of one third or more. Based on the latest version of survey*5 , looking at the responded foreign companies by industry, the manufacturing sector accounted for 17.4%, and non-manufacturing sector accounted for 82.6%, in fiscal 2019 results (Chart 2-9). Information and communications equipment in the manufacturing sector, and wholesaling in non-manufacturing sector accounted for the largest share respectively, and the share of non-manufacturing sector has been increasing.
-
*5
“54th Survey of Trends in Business Activities of Foreign Affiliates” (results of 2019). The number of companies surveyed was 5,748, the number of collected companies was 2,978, and the number of valid responses (in operation) was 2,808 (including finance / insurance and real estate).
Note: "Year" represents the fiscal year respondents based their answers on.
Source: "Survey of Trends in Business Activities of Foreign Affiliates" (METI)
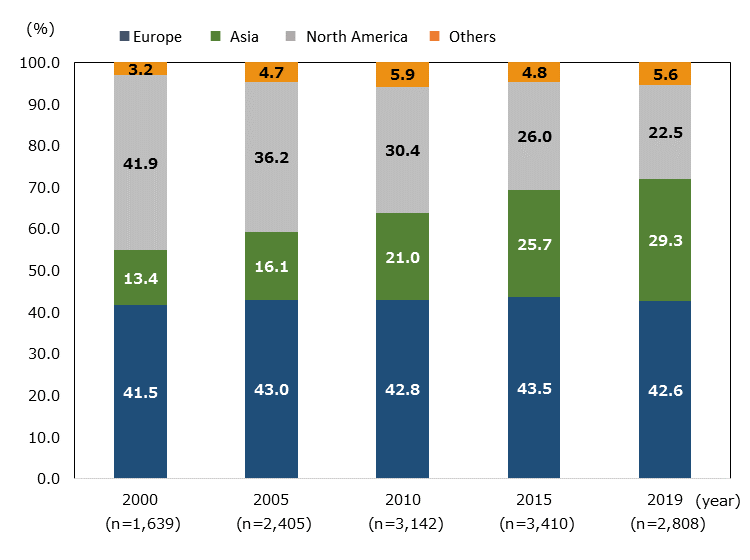
Looking at the foreign affiliates in Japan by the parent company’s location, Europe had the largest share with 42.6%, followed by Asia with 29.3%, and North America with 22.5% (Chart 2-10). Many of them have their parent companies in Germany and France in Europe, and China and South Korea in Asia. It can be seen that since 2000, the proportion of North American companies has declined, and that of Asian companies has increased.
Note: "Year" represents the fiscal year respondents based their answers on.
Source: "Survey of Trends in Business Activities of Foreign Affiliates" (METI)
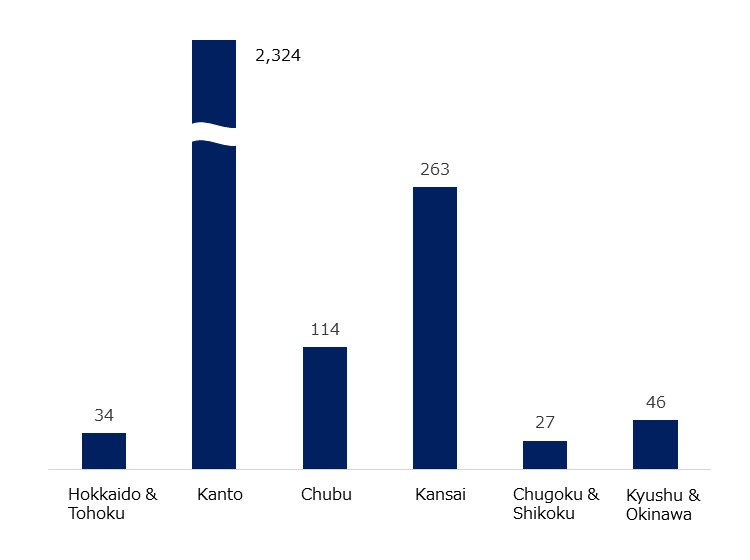
Looking at the distribution of foreign affiliates by region in Japan, they are concentrated in the Kanto region (2,324 companies), which is home to major metropolitan areas, followed by the Kinki region (263 companies) (Chart 2-11). By prefecture, over 60% of foreign-affiliated companies are concentrated in Tokyo, followed by Kanagawa, Osaka, and Aichi prefectures.
Source: METI's 54th Foreign Affiliate Trend Survey
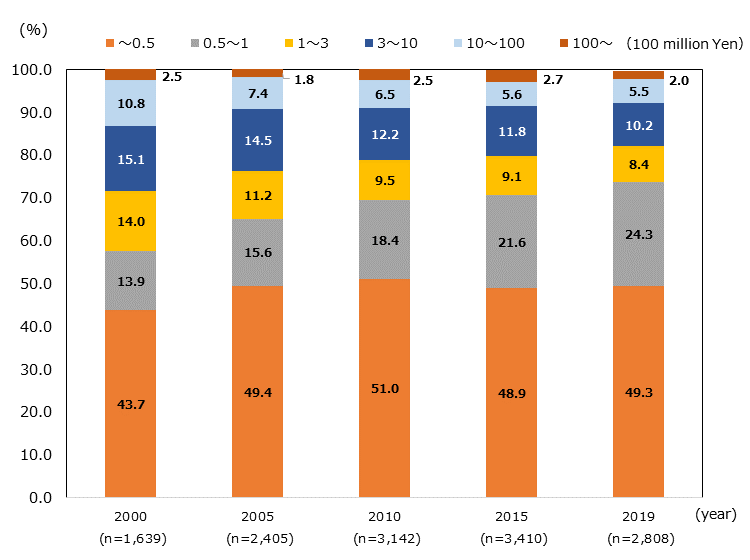
In terms of the size of share capital, 49.3% of foreign companies had “50 million yen or less”, followed by 24.3% with “50 million yen to 100 million yen,” and over 70% of the companies had share capital of “100 million yen or less” (Chart 2-12).
Note: "Year" represents the fiscal year respondents based their answers on.
Source: "Survey of Trends in Business Activities of Foreign Affiliates" (METI)
The greatest attractiveness of the Japanese market is its size
The survey asked foreign-affiliated companies about the attractiveness of doing business in Japan. According to the results, the top attractive factor for doing in Japan is its “large market size”, and more than 60% of companies valued the Japanese market, for its high income level and the large volume of customers for their products and services (Chart 2-13). Next, nearly 50% of companies cited the extensive of infrastructure such as transportation and information, and the verifiability of competitiveness for new products and services, as evaluating the characteristics of the market that is sensitive to the added value and trends in products and services.
| Rank | Answer | Total(n=2,468) | Manufacturing(n=418) | Non-manufacturing(n=2,050) |
|---|---|---|---|---|
| 1 | High income levels and high customer volumes for products and services (large market size) | 61.0 | 8.7 | 52.3 |
| 2 | Extensive infrastructure (transportation, energy, communications, etc.) | 47.6 | 8.1 | 39.6 |
| 3 | Sensitive to added value and trends in products and services, providing ground for measuring the competitiveness of new products and services | 47.3 | 8.4 | 38.9 |
| 4 | Concentration of global companies and affiliates | 36.8 | 6.1 | 30.7 |
| 5 | Developed living environment | 34.8 | 5.7 | 29.1 |
| 6 | Availability of quality personnel | 23.9 | 5.9 | 18.0 |
| 7 | Gateway to the Asian market. Optimal location for regional headquarters | 19.8 | 3.8 | 16.0 |
| 8 | Geographical advantage for accessing to headquarters and countries your company is managing | 18.2 | 3.1 | 15.1 |
| 9 | Solid financial environment, financing opportunities | 13.1 | 2.7 | 10.5 |
| 10 | High quality R&D environment | 10.4 | 3.8 | 6.6 |
On the other hand, more than 70% of the companies cited "high business costs," including labor costs and real estate, as an impediment to doing business in Japan (Chart 2-14)Among the business costs, many companies cited labor costs, tax burdens, and office rents. "Difficulty in securing personnel," such as engineers and persons with language skills was cited by more than 50%, and "exclusivity and distinctiveness of the Japanese market," such as the existence of affiliated transactions, personal connections, and business practices was cited by more than 40%.
| Rank | Answer |
Total (n=2,476) |
Manufacturing (n=418) |
Non-manufacturing (n=2,058) |
|---|---|---|---|---|
| 1 |
High cost of doing business (labor, tax, real estate, etc.) |
75.1 | 80.1 | 74.1 |
| 2 |
Difficulty in securing personnel (management, engineers, persons with language skills, common labor, etc.) |
53.6 | 57.4 | 52.8 |
| 3 |
Exclusivity and distinctiveness of the Japanese market (intragroup transactions, connections, shortage of market information in English, business practices, etc.) |
45.2 | 40.9 | 46.1 |
| 4 |
High standard that users demand from products and services (quality, delivery, price, etc.) |
44.3 | 49.5 | 43.2 |
| 5 |
Complicated administrative procedures (long time required from application to approval, complicated procedures, etc.) |
40.5 | 36.4 | 41.3 |
| 6 |
Strict regulations, permits and license system (legal restraints, product standards/inspection, etc.) |
39.3 | 37.6 | 39.7 |
| 7 |
Insufficient tax and other incentives (shortage of tax privileges, available assistance, etc.) |
18.7 | 21.5 | 18.1 |
| 8 |
Living environment for foreigners (admittance system of schools, hospitals, lifestyle differences, etc.) |
12.2 | 13.6 | 11.9 |
| 9 |
Difficulty in obtaining visas (unclear status of residence, difficulty in obtaining working and family stay visas, etc.) |
7.0 | 6.0 | 7.2 |
| 10 |
Difficulty in securing financing (difficult loan conditions, regulations regarding financing) |
6.7 | 6.9 | 6.7 |
| 11 | Other | 5.6 | 5.7 | 5.5 |
| 12 |
Difficult M&A environment (legal system, resistance to foreign capital) |
5.2 | 6.2 | 5.0 |
30% of foreign-affiliated companies cited they would expand their business
Although the business environment has changed drastically due to the impact of COVID-19, few foreign-affiliated companies are considering downsizing their business in the future. More than half of the companies replied they would maintain the status quo, and about 30% of them were planning to expand sales and marketing functions (Chart 2-15).
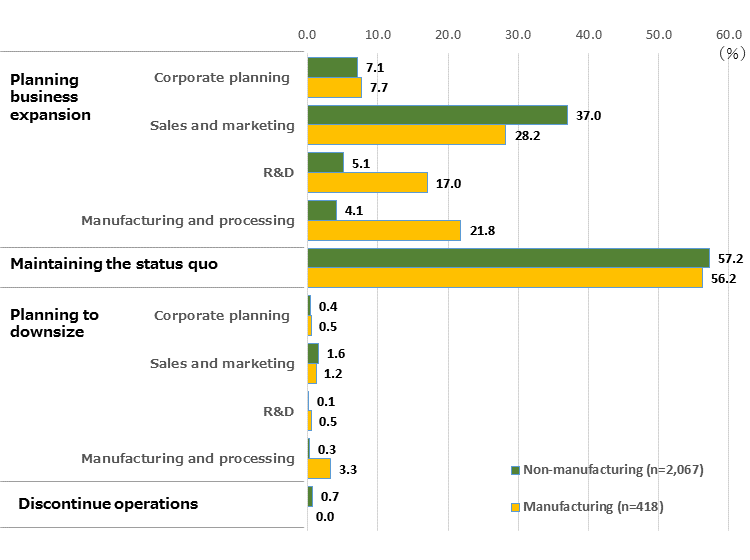
Source: "Survey of Trends in Business Activities of Foreign Affiliates" (METI)
On the other hand, regarding the impact of COVID-19 on their business, "decrease in sales/orders" accounted for about 60% of the total (Chart 2-16), indicating that, in particular in manufacturing sites, there is a labor surplus due to the decline in orders. In addition, more than 30% of companies cited “negative impact on distribution of products, goods and services " and "reduced clients/consumers due to movement restriction," and the response rate for these items was high in non-manufacturing sector. More than 60% of foreign-affiliated companies responded that they would have to maintain customers and develop new customers as business challenges, if these effects continue in the future (Chart 2-17). Also, as digitization progressed, 30% of the companies cited communication through digital technology as a challenge.
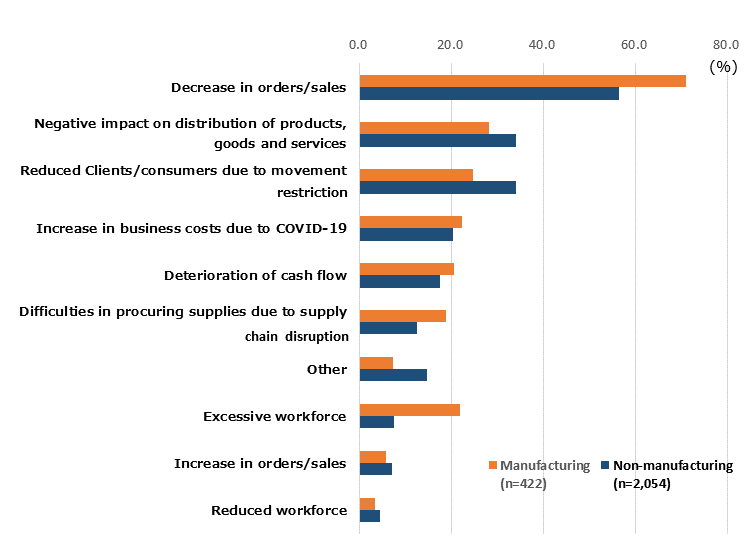
Source: "Survey of Trends in Business Activities of Foreign Affiliates" (METI)
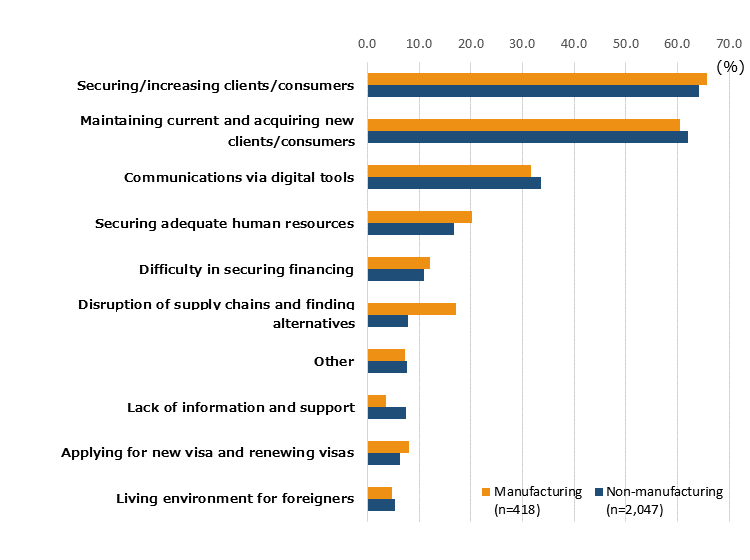
Source: "Survey of Trends in Business Activities of Foreign Affiliates" (METI)
JETRO Invest Japan Report 2021
Chapter1. Macroeconomic and Inward/Outward Foreign Direct Investment Trends in the World and Japan
-
Section1.
-
Section2.
Chapter2. Japan's Business Environment and Foreign-Affiliated Companies
-
Section1.
-
Section2.
-
Section3.
Chapter3. JETRO's Efforts to Promote Investment in Japan
-
Section1.
-
Section2.
Contact Us
Investing in and collaborating with Japan
We will do our very best to support your business expansion into and within Japan as well as business collaboration with Japanese companies. Please feel free to contact us via the form below for any inquiries.
Inquiry FormJETRO Worldwide
Our network covers over 50 countries worldwide. You can contact us at one of our local offices near you for consultation.
Worldwide Offices