


JETRO Invest Japan Report 2021
Chapter1. Macroeconomic and Inward/Outward Foreign Direct Investment Trends in the World and Japan Section2. FDI Trends in the World and Japan
Global Trends in Inward FDI part1
Global FDI in 2020 fell 34.7% year-on-year to 999 billion dollars
According to the United Nations Conference on Trade and Development (UNCTAD), global inward direct investment (net, flow; hereafter, inward FDI) was $999 billion in 2020 (Chart 1-5). It fell 34.7% from the previous year due largely to the impact of COVID-19, the amount of decline exceeded that of the 2008-2009 financial crisis, and it fell below $1 trillion for the first time since 2005.
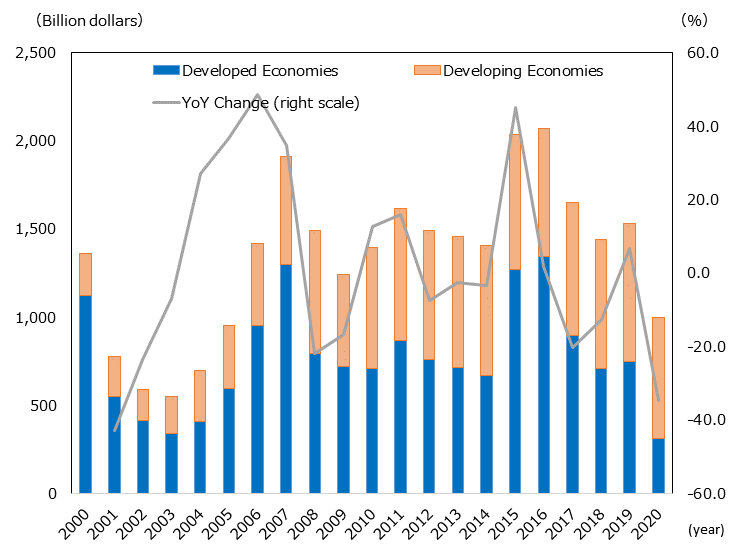
Note: "Developed economies" is as defined by UNCTAD. The amount of inflow to developing economies is computed by subtracting that of developed economies from that of the world.
Source: "World Investment Report 2021"(UNCTAD)
The amount of investment in developed economies decreased by 58.3% year-on-year to $312 billion, and that in emerging economies decreased by 12.1% to $687 billion (Chart 1-6). Both regions saw a year-on-year decrease. In particular, the investment amount in developed economies fell to the 2003 level. In 2020, inward FDI in developed economies accounted for 31.3% of the total, while emerging economies accounted for 68.7%, resulting in a record-high percentage for the latter. Developed economies’ share shrank due to a significant year-on-year decline, while emerging economies’ share exceeded 50% for three consecutive years since 2018.
| Region | 2019 | 2020 | ||||
|---|---|---|---|---|---|---|
| Flow | YoY | Share | Flow | YoY | Share | |
| World | 1,530 | 6.5 | 100.0 | 999 | -34.7 | 100.0 |
| Developed economies | 749 | 5.8 | 48.9 | 312 | -58.3 | 31.3 |
 Europe Europe
|
363 | 5.3 | 23.7 | 73 | -80.0 | 7.3 |
|
North America
|
309 | 18.2 | 20.2 | 180 | -41.7 | 18.0 |
| Developing economies | 781 | 7.2 | 51.1 | 687 | -12.1 | 68.7 |
|
Africa
|
47 | 3.9 | 3.1 | 40 | -15.6 | 4.0 |
|
Asia
|
516 | 3.8 | 33.7 | 535 | 3.8 | 53.6 |
|
Latin America
|
160 | 6.9 | 10.5 | 88 | -45.4 | 8.8 |
Among developed countries and regions, Europe fell 80.0% year on year to 73 billion dollars and North America fell 41.7% year on year to 180 billion dollars. By country and region, the U.S. remained the largest recipient of investment in 2020 but declined 40.2% from the previous year to 156 billion dollars (Chart 1-7). Regarding European countries, while Luxembourg (up 320.1% year-on-year) and Sweden (up 158.2% year-on-year) markedly exceeded the previous year's levels, in other major recipient countries, Germany fell by 34.1%, and Ireland fell by 58.8%. The Netherlands saw a new withdrawal. As a result, investment declined significantly in major countries from the previous year due to the decline in investment affected by COVID-19 and the financing of multinational companies.
| Ranking in 2020 | Country/Region | Change in Ranking | 2019 | 2020 |
2020 YoY |
2020 Share |
|---|---|---|---|---|---|---|
| 1 | United States |

|
261 | 156 | -40.2 | 15.6 |
| 2 | China |
|
141 | 149 | 5.7 | 15.0 |
| 3 | Hong Kong, China |

|
74 | 119 | 61.7 | 11.9 |
| 4 | Singapore |

|
114 | 91 | -20.7 | 9.1 |
| 5 | India |
|
51 | 64 | 26.7 | 6.4 |
| 6 | Luxembourg |
|
15 | 62 | 320.1 | 6.2 |
| 7 | Germany |
|
54 | 36 | -34.1 | 3.6 |
| 8 | Ireland |
|
81 | 33 | -58.8 | 3.3 |
| 9 | Mexico |
|
34 | 29 | -14.7 | 2.9 |
| 10 | Sweden |
|
10 | 26 | 158.2 | 2.6 |
| 20 | Japan |
|
15 | 10 | -29.5 | 1.0 |
| — | Netherlands |
|
49 | -115 | -335.5 | -11.5 |
| — | World | — | 1,530 | 999 | -34.7 | 100.0 |
The decline in emerging countries and regions was smaller than that in developed countries and regions. Asia saw a 3.8% year-on-year increase, while Africa (-15.6%) and Latin America (-45.4%) experienced decrease. Some Asian countries and regions saw gains in investment amount, such as China (5.7% increase to $149 billion), Hong Kong (61.7% increase to $119 billion), and India (26.7% increase to $64 billion). UNCTAD attributes the impact of multinational corporation’s financial strategies and the relatively early containment of the spread of COVID-19 in Asia to the solid investment in China
Number of global Greenfield investments declined for the second consecutive year
According to the fDi Markets (Financial Times), in 2020, the number of global Greenfield investments*3 (based on the date of publication) was 11,781, down 30.2% from the previous year (Chart 1-8). Due to the impact of COVID-19, the number of Greenfield investments fell sharply, marking the second consecutive year-on-year decline from the record high in 2018. In January-August of 2021, the number of greenfield investments has been sluggish even compared to the same period of the most recent two years, suggesting that it will take time for the number of global greenfield investments to pick up.
-
*3
Refers to a form of investment in which a corporation is newly established in the destination country
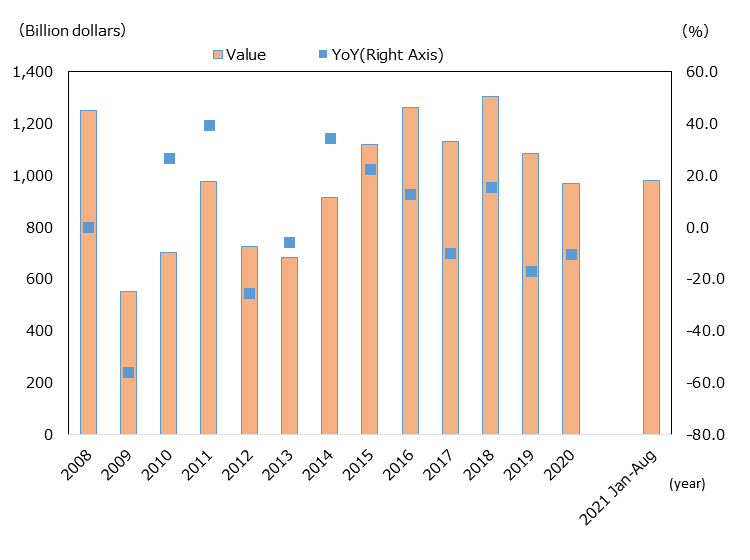
〔Source〕"fDi Markets"(Financial Times)(as of Oct.11th, 2021)
Looking at the number of investment projects in 2020 by investor country and region, the U.S. accounted for the largest number at 2,446 cases, down 32.9% from the previous year, followed by the U.K. (1,138 cases, down 28.7%), and Germany (1,051 cases, down 28.6%) (Chart 1-9). Although investments from all the top 10 countries and regions decreased from the previous year, there was little change in the ranking of countries and regions. Except Japan and China (excluding Hong Kong), all countries were Western countries..
| Ranking | Country/Region |
Change in Ranking |
# of Project | YoY | Share |
|---|---|---|---|---|---|
| 1 | US |
|
2,446 | -32.9 | 20.8 |
| 2 | Uk |
|
1,138 | -28.7 | 9.7 |
| 3 | Germany |
|
1,051 | -28.6 | 8.9 |
| 4 | France |
|
682 | -27.8 | 5.8 |
| 5 | Switzerland |
|
604 | -25.2 | 5.1 |
| 6 | Japan |
|
547 | -34.7 | 4.6 |
| 7 | China |
|
394 | -40.4 | 3.3 |
| 8 | Netherlands |
|
386 | -24.6 | 3.3 |
| 9 | Spain |
|
340 | -34.5 | 2.9 |
| 10 | Sweden |
|
299 | -7.7 | 2.5 |
| — | World | — | 11,781 | -30.2 | 100.0 |
In terms of recipient countries and regions of greenfield investments, the U.S. marked the largest number of 1,529 cases, down 20.7% from the previous year, followed by Germany (964 cases, down 17.5%), and the U.K. (873 cases, down 34.9%) (Chart 1-10). All of the top recipient countries and regions for greenfield investment saw a year-on-year decline.
| Ranking | Country/Region |
Change in Ranking |
# of Project | YoY | Share |
|---|---|---|---|---|---|
| 1 | US |
|
1,529 | -20.7 | 13.0 |
| 2 | Germany |
|
964 | -17.5 | 8.2 |
| 3 | UK |
|
873 | -34.9 | 7.4 |
| 4 | France |
|
511 | -29.9 | 4.3 |
| 5 | Spain |
|
452 | -33.8 | 3.8 |
| 6 | Poland |
|
380 | -1.0 | 3.2 |
| 7 | India |
|
373 | -45.1 | 3.2 |
| 8 | China |
|
358 | -54.6 | 3.0 |
| 9 | UAE |
|
351 | -13.8 | 3.0 |
| 10 | Canada |
|
300 | -15.7 | 2.5 |
| 18 | Japan |
|
197 | -14.3 | 1.7 |
| — | World | — | 11,781 | -30.2 | 100.0 |
JETRO Invest Japan Report 2021
Chapter1. Macroeconomic and Inward/Outward Foreign Direct Investment Trends in the World and Japan
-
Section1.
-
Section2.
Chapter2. Japan's Business Environment and Foreign-Affiliated Companies
-
Section1.
-
Section2.
-
Section3.
Chapter3. JETRO's Efforts to Promote Investment in Japan
-
Section1.
-
Section2.
Contact Us
Investing in and collaborating with Japan
We will do our very best to support your business expansion into and within Japan as well as business collaboration with Japanese companies. Please feel free to contact us via the form below for any inquiries.
Inquiry FormJETRO Worldwide
Our network covers over 50 countries worldwide. You can contact us at one of our local offices near you for consultation.
Worldwide Offices