


JETRO Invest Japan Report 2021
Chapter1. Macroeconomic and Inward/Outward Foreign Direct Investment Trends in the World and Japan Section2. FDI Trends in the World and Japan
Trends in Inward FDI to Japan part2
Greenfield investment declined for the second consecutive year
The number of greenfield investments in Japan in 2020 (based on the date of publication) fell 14.3% from 2019 to 197, marking the second consecutive year-on-year decline (Chart 1-26).
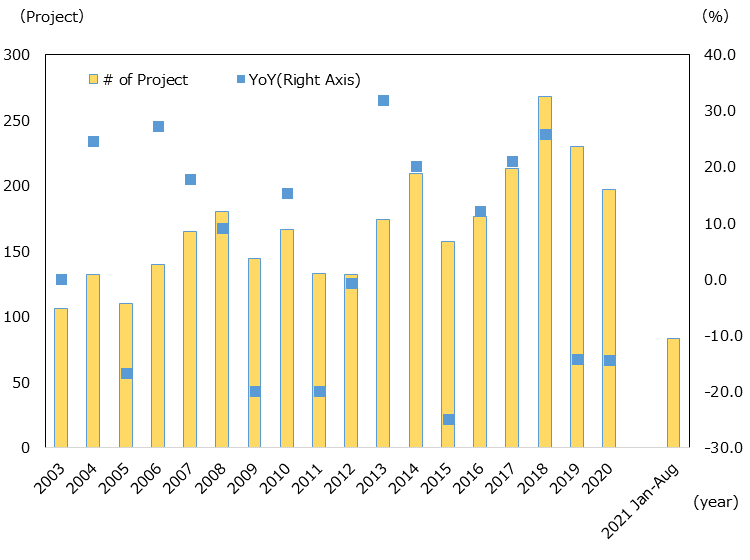
Source: "fDi Markets"(Financial Times)(as of Oct. 5th, 2021)
By investor countries and regions, the U.S. recorded the highest number of 61 cases, more than three times as many as Singapore, which came in second. Although the U.S. far exceeded other countries and regions, its number decreased by nearly 30% from the previous year (Chart 1-27). Singapore more than doubled its number of investments from 8 in 2019 to 19, while Germany marked the same number as the previous year (17 cases), and France (13 cases, -50.0% YoY) and the U.K. (12 cases, -36.8% YoY) both saw declines.
| Ranking | Country/Region |
Change in Ranking |
# of Projects | YoY | Share |
|---|---|---|---|---|---|
| 1 | US |

|
61 | -29.9 | 31 |
| 2 | Singapore |

|
19 | 137.5 | 9.6 |
| 3 | Germany |
|
17 | 0 | 8.6 |
| 4 | France |

|
13 | -50 | 6.6 |
| 5 | UK |
|
12 | -36.8 | 6.1 |
| — | Total | — | 197 | -14.3 | 100 |
Looking at greenfield investment in Japan in 2020 by industry, as in previous years, software (63 cases) was the largest, but down 12.5% from the previous year. Real estate (19, up 5.6% YoY) and renewable energy (17, up 21.4% YoY) followed. While the overall number of investments declined, these two industries saw year-on-year increases.
| Ranking |
Industry Sector |
Change in Ranking |
# of Projects | YoY | Share |
|---|---|---|---|---|---|
| 1 | Software & IT services |
|
63 | -12.5 | 32 |
| 2 | Real estate |
|
19 | 5.6 | 9.6 |
| 3 | Renewable energy |
|
17 | 21.4 | 8.6 |
| 4 | Business services |
|
16 | -30.4 | 8.1 |
| 5 | Industrial equipment |
|
13 | -7.1 | 6.6 |
| — | Total | — | 197 | -14.3 | 100 |
Number of M&A deals in Japan in 2020 increased from the previous year
In 2020, the number of cross-border M&A deals to Japan (hereafter, M&A deals in Japan), based on the date of completion, increased 11.6% from the previous year to 135 (Chart 1-29). The number of M&A deals in Japan had declined year on year for four consecutive years until 2018, but increased year on year in 2019 and 2020, marking the second consecutive year of growth.
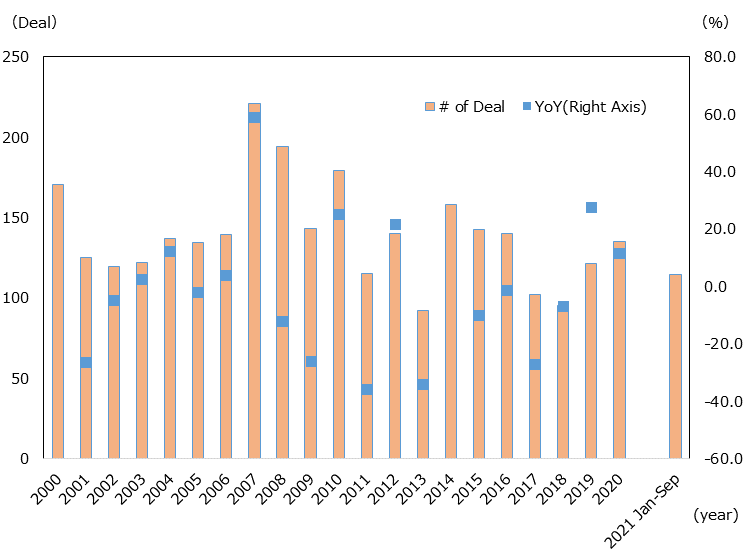
Source: "Workspace"(Refinitiv)(as of Jun.3rd, 2021)
Looking at the number of M&A deals in Japan in 2020 by country and region, the U.S. claimed the largest number with 31 deals (23.0% of the total), followed by Hong Kong (12 deals, 8.9%) and Singapore (10 deals, 7.4%) (Chart 1-30). The top five countries and regions were all Asian countries except for the U.S. and Germany.
| Ranking | Country/ Region | # of Project | YoY | Share |
|---|---|---|---|---|
| 1 | US | 31 | 14.8 | 23 |
| 2 | Hong Kong | 12 | -14.3 | 8.9 |
| 3 | Singapore | 10 | 0 | 7.4 |
| 4 | South Korea | 9 | 80 | 6.7 |
| 5 | Germany | 7 | 250 | 5.2 |
| — | Total | 135 | 15.4 | 100 |
Major M&A deals in Japan since 2020 include the acquisitions of UNIZO Holdings Company, Limited by Chitosea Investment Co., Ltd. (location of the ultimate parent company: Cayman Islands), and Takeda Consumer Healthcare Co., Ltd. by Oscar A-Co KK (location of the ultimate parent company: US) (Chart 1-31).
| Rank | Target Company |
Target Company Industry |
Acquirer |
Acquirer Parent country/region |
Acquirer Industry |
Date(Completion) | Transaction value(1 million dollars) |
|---|---|---|---|---|---|---|---|
| 1 | UNIZO Holdings Company, Limited | Real Estate | Chitocea Investment Co., Ltd. | Cayman Isl. | Finance | June 2020 | 4,375 |
| 2 | Takeda Consumer Healthcare Co., Ltd. | Healthcare | Oscar A-Co K.K. | US | Finance | March 2021 | 2,288 |
| 3 | Shiseido Company, Limited - Personal Care Business | Wholesale and services | Oriental Beauty Holding Co., Ltd. | UK | Finance | July 2021 | 1,524 |
| 4 | Showa Aircraft Industry Co., Ltd. | Industry | BCPE Planet Cayman LP | US | Finance | April 2020 | 851 |
| 5 | Accordia Golf Asset | Media and entertainment | Accordia Golf Co., Ltd. | Spain | Media and entertainment | September 2020 | 618 |
| 6 | Rakuten Group, Inc. | High-tech | Image Frame Investment (HK) Ltd. | China | Finance | March 2021 | 606 |
| 7 | Aspen Japan K.K. | Healthcare | Sandoz International GmbH | Switzerland | Healthcare | January 2020 | 441 |
| 8 | Takeda Pharmaceutical Company Limited-TachoSil Business | Healthcare | Corza Health, Inc. | US | Finance | February 2021 | 415 |
| 9 | ESR Redwood Kuki Distribution Center | Industry | Logistics-related joint venture | France | Finance | August 2020 | 369 |
| 10 | Hulic Co., Ltd. - Hewlett Packard Japan, G.K. Office Building (98.47%) | Real Estate | Tsubaki special-purpose company | Singapore | Finance | June 2021 | 353 |
Sluggish FDI Flow to Japan in the first half of 2021
As mentioned earlier, in World Investment Report 2021 released in June 2021, UNCTAD predicted global inward FDI in 2021 to increase by around 10 to 15% over the previous year. The amount of inward FDI to Japan from January to August 2021 was sluggish compared to the same period of the previous year. In terms of trends in greenfield investment (based on the date of publication) that indicates the establishment and expansion of bases in Japan by foreign companies, the number of cases from January to August 2021 was 83, less than 60% of 144 during the previous year's same period. Regarding countermeasures against COVID-19, although Japan lagged behind other countries in starting vaccination, 65.8% of the total population has been fully vaccinated as of October 14, 2021, boding well for the country’s future progress in economic activities. Also, if the easing of restrictions on travel from abroad progresses, it is expected to lead to the establishment of new bases and the expansion of existing bases by foreign companies, which have been sluggish since 2020.
FDI Stock in Japan
FDI stock in Japan at the end of 2020 was 39.7 trillion yen
The outstanding balance of FDI in Japan at the end of 2020 reached a new high of 39.7 trillion yen, up 15.6% from the previous year, reflecting the large amount of inward FDI to Japan in the same year (Chart 1-32). The ratio of the balance to GDP increased from 6.1% to 7.4%.
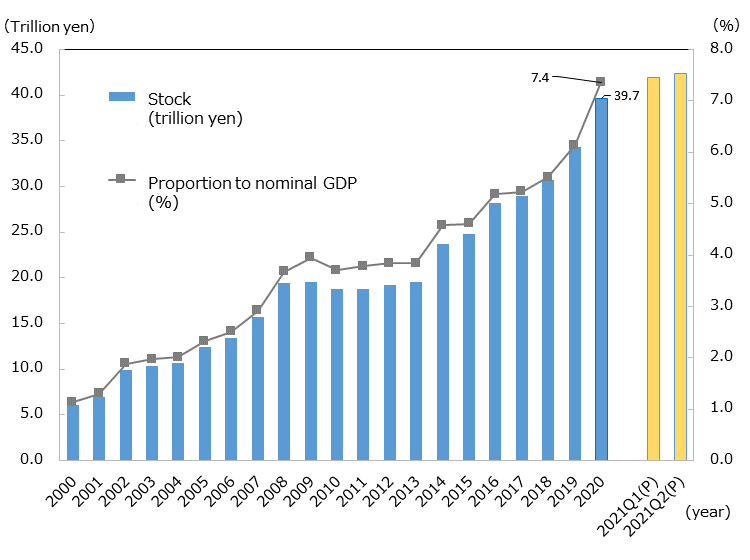
Source: "International Investment Position of Japan" (Ministry of Finance, Bank of Japan), "National Accounts of Japan" (Japan Cabinet Office)
Looking at the FDI stock at the year-end by forms of capital, equity capital increased 1.5% YoY to 19 trillion yen (46.9% of the total), debt instrument increased 63.1% YoY to 13 trillion yen (33.6%), and reinvestment of earnings decreased 1.1% YoY to 8 trillion yen (19.5%). As mentioned earlier, the share of debt instrument in the outstanding balance also increased to more than 30% from 23.8% at the end of 2019, reflecting the large inflow of debt instrument in FDI in 2020. As for the balance of debt instrument by country and region, the U.K. saw a 335.5% increase from the previous year to 4.4 trillion yen, the U.S. increased by 84.8% to 2.7 trillion yen, and the Swiss increased by 272.5% to 900 billion yen, evidencing significant inflow of debt instrument from these countries in 2020.
As for the FDI stock in Japan by investor region, Europe had the largest share at 18.5 trillion yen (46.7% of the total), followed by North America at 9.6 trillion yen (24.2%), and Asia at 9 trillion yen (22.6%) (Chart 1-33). By country and region, the U.S. remained the largest at 9.4 trillion yen (23.7% of the total), followed by the U.K. at 5.8 trillion yen (14.7%) (Chart 1-34). The top 10 countries and regions accounted for 86.0% of the total FDI stock in Japan, which were mainly countries of Europe and Asia except for the U.S.
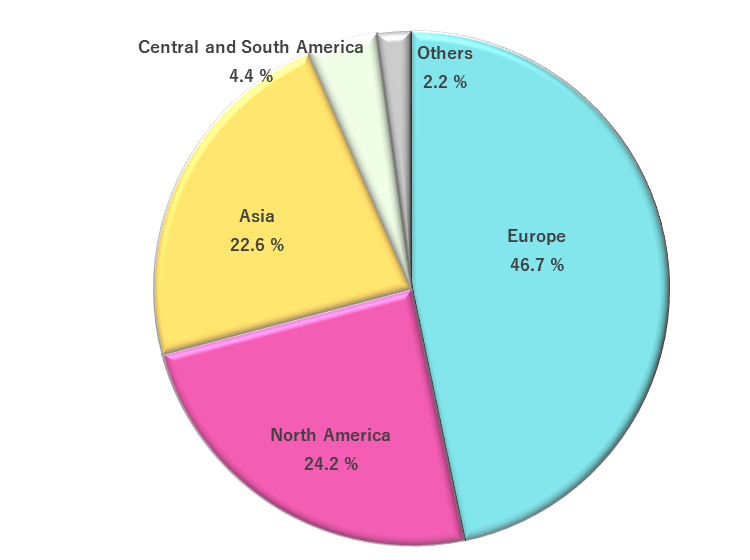
Source: "International Investment Position of Japan" (Ministry of Finance, Bank of Japan)
| Rank | Country/region | Stock | Ratio |
|---|---|---|---|
| 1 | U.S. | 9,405 | 23.7 |
| 2 | U.K. | 5,832 | 14.7 |
| 3 | Singapore | 4,294 | 10.8 |
| 4 | Netherlands | 4,228 | 10.7 |
| 5 | France | 3,320 | 8.4 |
| 6 | Switzerland | 2,337 | 5.9 |
| 7 | Hong Kong | 1,466 | 3.7 |
| 8 | Cayman Isl. | 1,285 | 3.2 |
| 9 | Germany | 997 | 2.5 |
| 10 | South Korea | 936 | 2.4 |
| - | Others | 5,565 | 14.0 |
| - | Total | 39,669 | 100 |
Non-manufacturing industry accounted for over 60% of FDI stock in Japan by industry at the end of 2020
The FDI stock in Japan by industry at the end of 2020 was 24.1 trillion yen, down 1.4% from the previous year. The manufacturing sector accounted for 37.2%, and the non-manufacturing sector accounted for 62.8% (Chart 1-35). The large proportion of FDI inflow into the non-manufacturing sector during 2020 increased the stock in this sector.
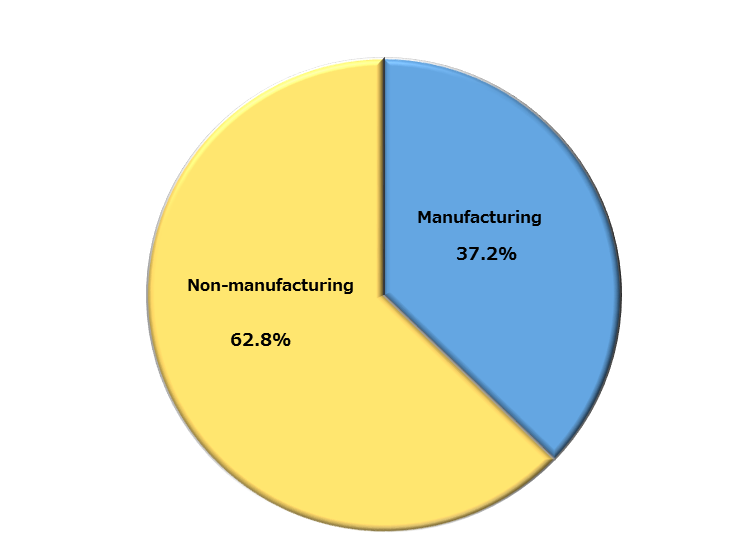
Note: Based upon different prindples from statistics for FDI by region.
Source: "International Investment Position of Japan" (Ministry of Finance, Bank of Japan)
Looking at detailed industries, the stock of finance and insurance increased 41.6% year on year to 10 trillion yen, accounting for the largest share (41.6% of the total) due to substantial investments in 2020 (Chart 1-36). Transportation equipment, down 9.7% YoY to 3.3 trillion yen (13.6%), and electrical machinery, down 9.2% YoY to 2.3 trillion yen (9.5%), followed.
| Rank | Industry | Stock | Ratio |
|---|---|---|---|
| 1 | Finance and insurance | 10,015 | 41.6 |
| 2 | Transportation equipment | 3,276 | 13.6 |
| 3 | Electric machinery | 2,290 | 9.5 |
| 4 | Communications | 2,045 | 8.5 |
| 5 | Chemicals and pharmaceuticals | 1,793 | 7.4 |
| 6 | Services | 1,363 | 5.7 |
| 7 | Real estate | 531 | 2.2 |
| 8 | General machinery | 495 | 2.1 |
| 9 | Transportation | 422 | 1.8 |
| 10 | Glass and ceramics | 372 | 1.5 |
| - | Others | 1,474 | 6.1 |
| - | Total | 24,075 | 100 |
JETRO Invest Japan Report 2021
Chapter1. Macroeconomic and Inward/Outward Foreign Direct Investment Trends in the World and Japan
-
Section1.
-
Section2.
Chapter2. Japan's Business Environment and Foreign-Affiliated Companies
-
Section1.
-
Section2.
-
Section3.
Chapter3. JETRO's Efforts to Promote Investment in Japan
-
Section1.
-
Section2.
Contact Us
Investing in and collaborating with Japan
We will do our very best to support your business expansion into and within Japan as well as business collaboration with Japanese companies. Please feel free to contact us via the form below for any inquiries.
Inquiry FormJETRO Worldwide
Our network covers over 50 countries worldwide. You can contact us at one of our local offices near you for consultation.
Worldwide Offices