


JETRO Invest Japan Report 2021
Chapter2. Japan's Business Environment and Foreign-Affiliated Companies Section1. Strategy for Promoting FDI in Japan and Japan's Business Environment
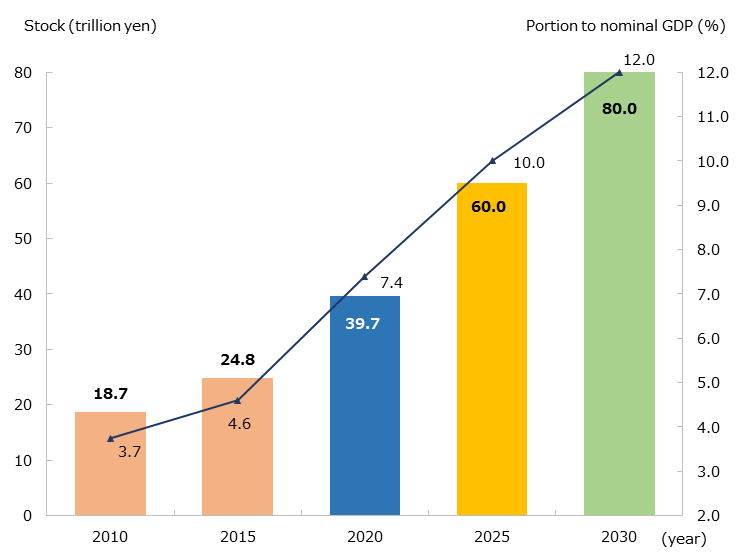
Targeting to double the FDI stock in Japan by 2030
As seen in Chapter 1, the FDI stock in Japan at the end of 2020 was 39.7 trillion yen, and the ratio to GDP increased to 7.4%. As a result, the policy target of 35 trillion yen in FDI stock by the end of 2020*1 has been achieved. In June 2021, the Council for Promotion of Foreign Direct Investment in Japan setected the FDI stock in Japan as a KPI (Key Performance Indicator) It stipulated a new target of 80 trillion yen with its ratio to GDP: 12% by 2030. Also, the interim target was set at "60 trillion yen with its ratio to GDP at 10% by 2025” and an interim evaluation will be conducted at an appropriate time. (Chart 2-1).
Note: The balance of direct investment in Japan is based on the 6th edition of the Balance of Payments Manual
Source: "International Investment Position of Japan" (Ministry of Finance, Bank of Japan), "National Accounts of Japan" (Japan Cabinet Office)
The development of the business environment needs to be accelerated to achieve this policy goal. The Strategy for Promoting Foreign Direct Investment in Japan, stipulated along with the new targets at the Council for Promotion of Foreign Direct Investment in Japan on June 2, 2021, has three pillars:
(1) Creatiing a new digital green market and building innovation ecosystems.
(2) Accelerating the development of business environments in response to global changes.
(3) Developing investment grounds through public-private partnerships utilizing regional strengths.
In addition, it has set out the following three indicators as supplementary indicators. The first is value added*2 created by business activities of foreign-affiliated companies*3 from a macroeconomic perspective. It targets to doubled from 17 trillion yen in 2018 to 34 trillion yen by 2030 with an ongoing follow-up.
At present, 42.9% of foreign-affiliated companies*4 are concentrated in Tokyo. The second supplementary indicator is the number of foreign-affiliated companies by prefecture. From the perspective of expanding the impact on the economy into regions, the target for the number of foreign-affiliated companies in prefectures outside Tokyo has been set at 10,000 by 2026.
The number of highly skilled foreigners entering Japan has become the third supplementary indicator to promote innovation. The target is to achieve 200,000 business management personnel to enter the country by 2030.
-
*1
Japan Revitalization Strategy (Cabinet decision on June 14, 2013)
-
*2
Value added = Operating income + Total salary + Depreciable Assets + Welfare expenses + Rent of movable property and real estate + Taxes and dues
-
*3
Companies stipulated in the Basic Survey of Corporate Activities (METI), in which the number of shares held or the ratio of the amount of investment by foreign investors to the total number of outstanding shares or the total amount of investment of the company exceeds one-third.
-
*4
Enterprises with a foreign ownership ratio of one third or more according to the 2016 Economic Census for Business Activity (METI)
Indicators of business environment
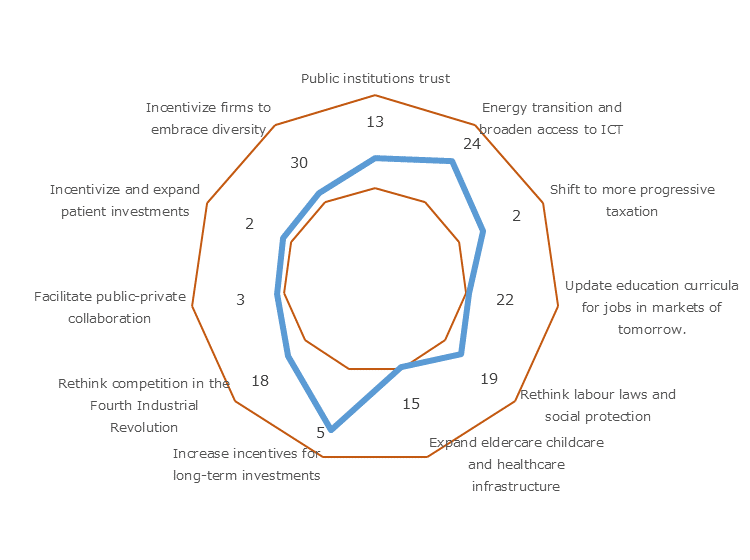
In 2020, there were many special business environment analyses in the COVID-19 pandemics. The World Economic Forum published rankings in 11 priorities (scored 0 to 100 points) in the four broad areas for business environment transformation for 37 countries and regions in place of the usual Global Competitiveness Index ranking.
The first area has three indicators of an effective business environment: "Public institutions trust," "Energy transition and broaden access to IT," and "Shift to more progressive taxation." Japan ranks second in the shift to more progressive taxation. The second area relates to human capital, and Japan ranks in the middle for all indicators, including "Update education curricula for jobs in markets of tomorrow," "Rethink labor laws and social protection," and "Expand eldercare, childcare, and healthcare." The third area is related to markets and includes indicators such as "Increase incentives for long-term investments," "Rethink competition in the Fourth Industrial Revolution," and "Facilitate public-private collaboration." Japan ranks third in the public-private collaboration. The fourth area is related to the innovation ecosystem, with "Incentivize and expand patient investments in research, innovation and invention" and "Incentivize firms to embrace diversity" as indicators. Japan ranks second in the incentives for research, innovation and invention investments. The only area in which Japan scored below 50 was "Expand eldercare, childcare, and healthcare" (49.3 points, 15th place), and the scores were all above average except for "Energy transition and broader access to IT" (76.9 points, 24th place) , “Incentivize firms to embrace diversity”(56.0 points, 30th place), and “Update education curricula for jobs of tomorrow”(51.3 points, 22nd place) (Chart 2-2).
Source: Global Competitiveness Report (World Economic Forum)
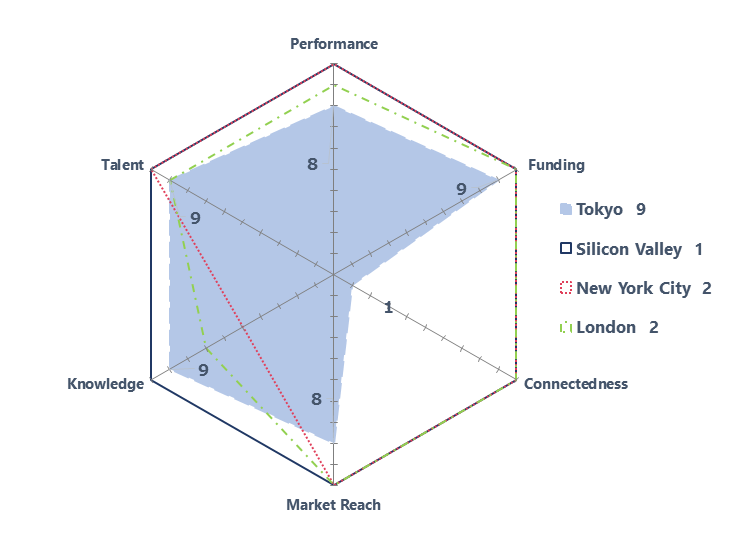
Tokyo ranked ninth in the environmental Indicators for Startup Companies
On September 22, 2021, US research firm Startup Genome released the “Global Startup Ecosystem Report (GSER) 2021.” This report covers and ranks more than 150 cities around the world. Tokyo ranked ninth by moving up six positions from 15th in 2020 making it one of the top 10 cities for the first time. There was no change in the top five (Chart 2-3).
| Rank 2021 | Country | City | Rank 2020 | Country | City | |
|---|---|---|---|---|---|---|
| 1 | USA | Silicon Valley | — | 1 | USA | Silicon Valley |
| 2 | USA | New York City | — | 2 | USA | New York City |
| 2 | UK | London | — | 2 | UK | London |
| 4 | China | Beijing | — | 4 | China | Beijing |
| 5 | USA | Boston | — | 5 | USA | Boston |
| 6 | USA | Los Angeles | — | 6 | Israel | Tel Aviv - Jerusalem |
| 6 | Israel | Tel Aviv |

|
6 | USA | Los Angeles |
| 8 | China | Shanghai | — | 8 | China | Shanghai |
| 9 | Japan | Tokyo |

|
9 | USA | Seattle |
| 10 | USA | Seattle |
|
10 | Sweden | Stockholm |
| 11 | USA | Washington DC | — | 11 | USA | Washington DC |
| 12 | France | Paris |
|
12 | Netherlands | Amsterdam |
| 13 | Netherlands | Amsterdam-Delta |
|
13 | France | Paris |
| 14 | Canada | Toronto-Waterloo |
|
14 | USA | Chicago |
| 15 | USA | Chicago |
|
15 | Japan | Tokyo |
| 16 | Korea | Seoul |
|
16 | Germany | Berlin |
| 17 | Sweden | Stockholm |
|
17 | Singapore | Singapore |
| 18 | Singapore | Singapore |
|
18 | Canada | Toronto-Waterloo |
| 19 | China | Shenzhen |
|
19 | USA | Austin |
| 20 | USA | Austin |
|
20 | Korea | Seoul |
GSER evaluates six success factors on a scale of 1 to 10 and ranks the top 40 cities according to its own calculation method. Looking at the scores for the top three cities, Silicon Valley scored a perfect 10 for all factors, and New York and London, which ranked second, scored 10 or 9 on all except R&D. Tokyo scored highly for "funding," "human resources," and "R&D," each of which received 9 points. On the other hand, Tokyo received a single point for “connectedness.” More cooperation among regional networks is required (Chart 2-4).
Note: Figures in each item refer to the score in Tokyo.
Source: GSER2021 (startup genomes).
JETRO Invest Japan Report 2021
Chapter1. Macroeconomic and Inward/Outward Foreign Direct Investment Trends in the World and Japan
-
Section1.
-
Section2.
Chapter2. Japan's Business Environment and Foreign-Affiliated Companies
-
Section1.
-
Section2.
-
Section3.
Chapter3. JETRO's Efforts to Promote Investment in Japan
-
Section1.
-
Section2.
Contact Us
Investing in and collaborating with Japan
We will do our very best to support your business expansion into and within Japan as well as business collaboration with Japanese companies. Please feel free to contact us via the form below for any inquiries.
Inquiry FormJETRO Worldwide
Our network covers over 50 countries worldwide. You can contact us at one of our local offices near you for consultation.
Worldwide Offices