


JETRO Invest Japan Report 2021
Chapter1. Macroeconomic and Inward/Outward Foreign Direct Investment Trends in the World and Japan Section2. FDI Trends in the World and Japan
Global Trends in Outward FDI
Looking at the global outward FDI (net flow; hereinafter outward FDI) by region in 2020, developed economies accounted for 46.9%, and developing economies 53.1% (Chart 1-18). Investment by developed countries and regions, in particular, fell sharply (Chart 1-19). The amount of outward FDI by Japan, the largest investor in 2018 and 2019, fell by 49.0% year on year, and there was a net withdrawal of investment by the Netherlands. The ratio of outward FDI from developed economies fell below 50% for the first time in two years, and that from developing economies (53.1% of the total) reached a record high.
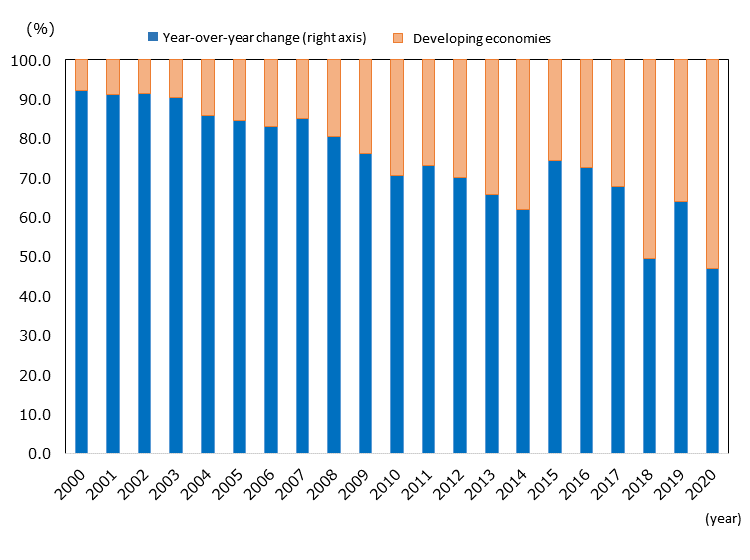
Note: "Developed economies" is as defined by UNCTAD. The amount of inflow to developing economies is computed by subtracting that of developed economies from that of the world.
Source: "World Investment Report 2021" (UNCTAD)
|
Ranking in 2020 |
Country/Region |
Change in Ranking |
2019 | 2020 |
2020 YoY |
2020 Share |
|---|---|---|---|---|---|---|
| 1 | China |

|
137 | 133 | -2.9 | 18.0 |
| 2 | Luxembourg |
|
34 | 127 | 268.7 | 17.2 |
| 3 | Japan |

|
227 | 116 | -49.0 | 15.6 |
| 4 | Hong Kong, China |
|
53 | 102 | 92.1 | 13.8 |
| 5 | United States |
|
94 | 93 | -0.8 | 12.5 |
| 6 | Canada |

|
79 | 49 | -38.3 | 6.6 |
| 7 | France |
|
39 | 44 | 14.3 | 6.0 |
| 8 | Germany |
|
139 | 35 | -74.9 | 4.7 |
| 9 | Korea, Republic of |
|
35 | 32 | -7.8 | 4.4 |
| 10 | Singapore |
|
51 | 32 | -36.0 | 4.4 |
| — | World | — | 1,220 | 740 | -39.4 | 100.0 |
Turning eyes to other major countries and regions, China was the largest investor country at $133 billion, down 2.9% from the previous year. According to UNCTAD, investment activities were particularly robust in countries and regions surrounding One Way One Road, despite tighter investment regulations in the U.S. and other countries. As for the share of global outward FDI by major countries and regions, the top five countries and regions accounted for approximately 80%, manifesting a concentration of investment sources in some areas.
JETRO Invest Japan Report 2021
Chapter1. Macroeconomic and Inward/Outward Foreign Direct Investment Trends in the World and Japan
-
Section1.
-
Section2.
Chapter2. Japan's Business Environment and Foreign-Affiliated Companies
-
Section1.
-
Section2.
-
Section3.
Chapter3. JETRO's Efforts to Promote Investment in Japan
-
Section1.
-
Section2.
Contact Us
Investing in and collaborating with Japan
We will do our very best to support your business expansion into and within Japan as well as business collaboration with Japanese companies. Please feel free to contact us via the form below for any inquiries.
Inquiry FormJETRO Worldwide
Our network covers over 50 countries worldwide. You can contact us at one of our local offices near you for consultation.
Worldwide Offices