


JETRO Invest Japan Report 2021
Chapter1. Macroeconomic and Inward/Outward Foreign Direct Investment Trends in the World and Japan Section1. Macroeconomic Trends in the World and Japan
Macroeconomic Trends in the World
World economy expected to recover in 2021, but with regional unevenness
According to the World Economic Outlook (WEO) released in October 2021 by the International Monetary Fund (IMF) (Chart 1-1), the global real GDP growth rate in 2020 was -3.1% in 2020, while the forecast for 2021 was 5.9%.
| Country/Region | 2019 | 2020 | 2021 | 2022 |
|---|---|---|---|---|
| World | 2.8 | -3.1 | 5.9 | 4.9 |
| Developed Economies | 1.6 | -4.5 | 5.2 | 4.5 |
 US US
|
2.2 | -3.4 | 6.0 | 5.2 |
|
Japan
|
0.0 | -4.6 | 2.4 | 3.2 |
|
UK
|
1.4 | -9.8 | 6.8 | 5.0 |
|
EuroArea
|
1.3 | -6.3 | 5.0 | 4.3 |
|
Germany
|
0.6 | -4.6 | 3.1 | 4.6 |
| Developing Economies | 3.7 | -2.1 | 6.4 | 5.1 |
|
Emerging and Developing Asia
|
5.4 | -0.8 | 7.2 | 6.3 |
|
China
|
6.0 | 2.3 | 8.0 | 5.6 |
|
India
|
4.0 | -7.3 | 9.5 | 8.5 |
|
ASEAN-5
|
4.9 | -3.4 | 2.9 | 5.8 |
|
Latin America
|
0.1 | -7.0 | 6.3 | 3.0 |
|
Middle East and Central Asia
|
1.4 | -2.8 | 4.1 | 4.1 |
|
Sub-Saharan Africa
|
3.2 | -1.7 | 3.7 | 3.8 |
The economic growth projections have been revised from the last WEO of July 2021 based on the situation in each region. The projected growth rate of developed economies and regions in 2021 has been revised upward by 0.4 percentage point in light of the new fiscal policy that the U.S. government is considering introducing. On the other hand, that for emerging economies and regions has been revised downward by 0.4 percentage point. In particular, the growth rate projection for emerging Asian economies has been lowered by 1.0 percentage point due to the re-spread of novel coronaviruses (hereafter, COVID-19) in India and Southeast Asian countries and the shrinkage in the scale of China's fiscal policies and public investment. As upward revisions in developed economies offset downward revisions in emerging economies, the global growth rate forecast has remained unchanged from the previous WEO. However, different responses to COVID-19 across counties and regions have resulted in uneven projected economic recoveries among countries and regions.
The future recovery of the world economy will continue to be centered on the response to COVID-19.
Macroeconomic Trends in Japan
Negative growth in 2020 due to COVID-19, but GDP expected to recover within 2021
According to the Cabinet Office, Japan's real GDP decreased by 4.7% to 528.5 trillion yen in 2020 (Chart 1-2). 2020 was heavily affected by COVID-19 and marked negative growth for the first time since 2009.
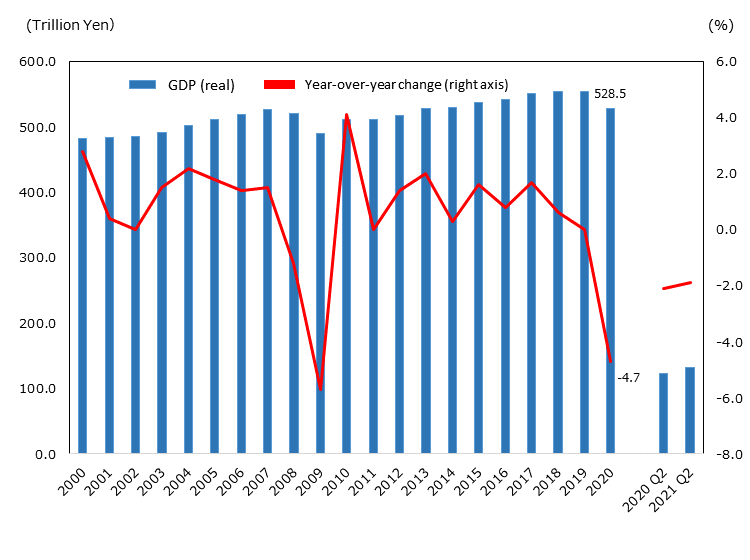
Source: Cabinet Office (As of May. 18th, 2021)
Looking at the breakdown of GDP*1 by demand item in 2020, private final consumption expenditure accounted for the largest share of the total at 53.7%, followed by government final consumption expenditure (21.5% of the total) and private non-residential investment (16.2% of the total) (Chart 1-3). Of the demand items, only the government final consumption expenditure (up 2.8% year-on-year) and public fixed capital formation*2 (up 3.6% year-on-year) increased, while all other items decreased year-on-year. In particular, private final consumption expenditure, which accounted for the largest share, fell 5.8% from the previous year, contributing to about two-thirds of the negative growth in real GDP in 2020.
-
*1
There is a net export (-0.8%), and the sum of the graphs does not add up to 100%.
-
*2
Public fixed capital formation refers to public investment by the government to develop infrastructure such as roads.
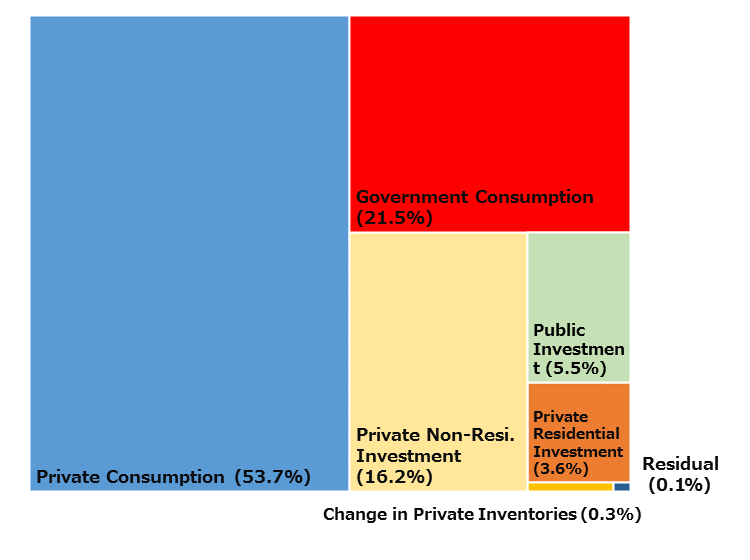
Source: Cabinet Office (As of May. 18th, 2021)
As for the current trends in Japan's economy, the real GDP growth rate for the third quarter and fourth quarter of 2020 was 5.3% and 2.8%, respectively, but was -1.1% in the first quarter of 2021 and a slight pick-up of 0.5% in the second quarter (Chart 1-4). In a report released by OECD in May 2021, Japan’s GDP per capita will recover to pre-pandemic levels around the third quarter of 2021. One key to the recovery of the Japanese economy is the speed of vaccination against COVID-19. Although the start of vaccination in Japan lagged behind other countries and regions, after it started in March 2021, the number of people who completed the second dose of vaccination has exceeded 60% of the total population as of October 4, 2021.
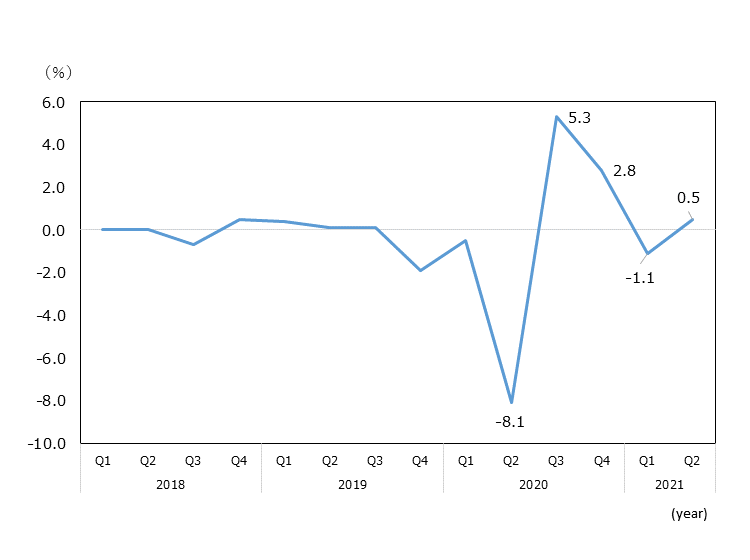
Source: Cabinet Office (As of Oct 16th, 2021)
JETRO Invest Japan Report 2021
Chapter1. Macroeconomic and Inward/Outward Foreign Direct Investment Trends in the World and Japan
-
Section1.
-
Section2.
Chapter2. Japan's Business Environment and Foreign-Affiliated Companies
-
Section1.
-
Section2.
-
Section3.
Chapter3. JETRO's Efforts to Promote Investment in Japan
-
Section1.
-
Section2.
Contact Us
Investing in and collaborating with Japan
We will do our very best to support your business expansion into and within Japan as well as business collaboration with Japanese companies. Please feel free to contact us via the form below for any inquiries.
Inquiry FormJETRO Worldwide
Our network covers over 50 countries worldwide. You can contact us at one of our local offices near you for consultation.
Worldwide Offices