


JETRO Invest Japan Report 2021
Chapter1. Macroeconomic and Inward/Outward Foreign Direct Investment Trends in the World and Japan Section2. FDI Trends in the World and Japan
Trends in Inward FDI to Japan part1
FDI Flow to Japan
Inward FDI to Japan rose to 7.1 trillion yen in 2020
In 2020, inward FDI to Japan (net, flow) was 7.1 trillion yen, up 61.8% from the previous year (Chart 1-20). This is the largest amount since 2014, for which comparable data is available, far exceeding the amount of 4.5 trillion yen in 2016.
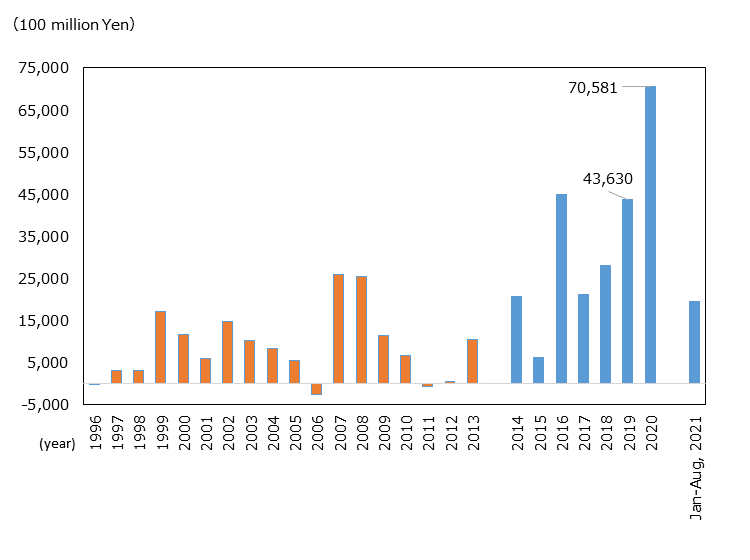
Note: The figures before 2013 are calculated based upon a different principle.
Source: "Balance of Payments" (Ministry of Finance, Bank of Japan)
Breaking down FDI flow to Japan in 2020 (7.1 trillion yen) by forms of capital, equity capital*4 fell 49.8% year on year to 600 billion yen, reinvestment of earnings*5 decreased 2.6% to 1.4 trillion yen, while debt instrument*6 increased 183.7% to 5.1 trillion yen (Chart 1-21). Reflecting the economic and social impact of the global COVID-19 crisis, equity capital, which represents the trend of new investment and capital increase in Japan, halved compared to the record high in 2019. On the other hand, debt instrument, which include lending and borrowing between companies with capital ties, has increased significantly. This increase was the main factor behind increasing FDI flow to Japan in 2020. In particular, according to the announcement by the Ministry of Finance in June 2020*7, when debt instrument rose significantly, the increase in debt instrument was attributable to "borrowings from overseas affiliates, etc." by Japanese companies. Because of the recording principle of these statistics (asset and liability principle*8), borrowing by Japanese companies from their overseas subsidiaries, etc. is reflected in the amount of FDI flow to Japan, which has pushed up the overall amount.
-
*4
Equity capital: share purchase or capital exchange with a value of at least 10% of voting rights, equity interest on investment to a branch and other capital expenditures by a foreign company is recorded.
-
*5
Reinvestment of earnings: proportion of undistributed earnings from a Japanese business or local subsidiary with foreign ownership corresponding to the level of foreign investment is recorded.
-
*6
Debt instrument: cash loans exchanged between parent and subsidiary and acquisition/disposal of bonds are recorded.
-
*7
-
*8
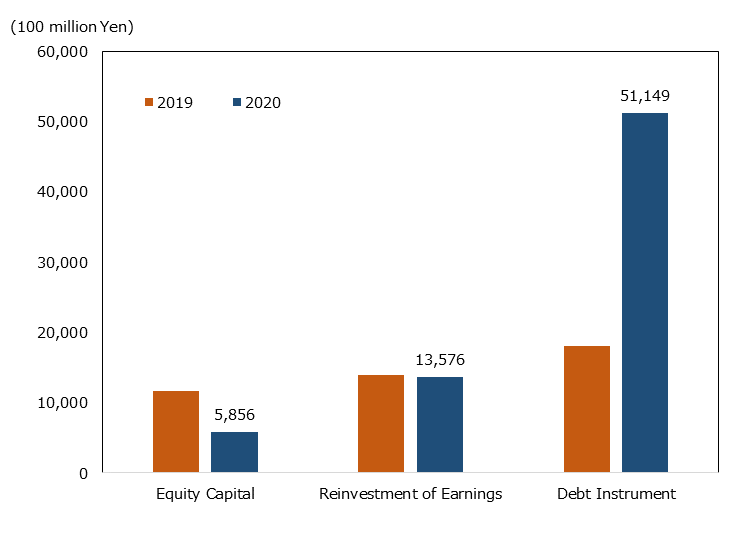
Source: "Balance of Payments" (MoF, BoJ)
By region, Europe accounted for the largest share of FDI flow to Japan in 2020 at 4.1 trillion yen, up 351.3% from the previous year, followed by North America at 2.3 trillion yen, up 20.6%, and Asia at 1 trillion yen, down 1.6% (Chart 1-22).
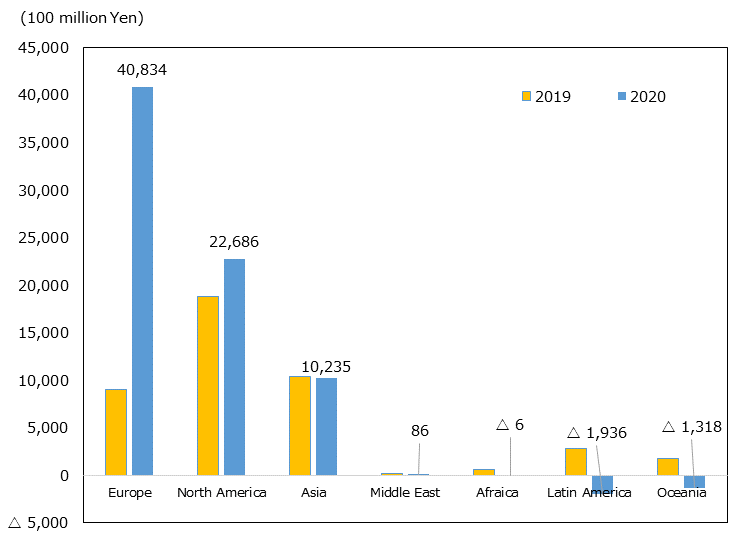
Source: "Balance of Payments" (MoF, BoJ)
Among Europe that accounted for the largest share of FDI flow to Japan, the U.K. invested the largest amount of all countries and regions at 3.3 trillion yen, up 969.9% from the previous year, and Switzerland the third largest at 800 billion yen, up 704.4%. The investment from these two countries accounted for the majority of the investment from Europe. The U.S., the second largest, invested 2.3 trillion yen, a 21.1% year-on-year increase. Looking at investments from the U.K., the U.S., and Switzerland, the top countries in the amount of FDI flow to Japan in 2020, debt instrument accounted for the largest portion.*9
-
*9
Statistics on the amount of FDI in Japan for a single year do not show data by types of capital for each investor country or region. See trends in the amount outstanding of FDI in Japan, for which statistics data are available by investor country/region and types of capital.
|
2020 Ranking |
Investor Country/ Region |
Change in Ranking | 2020 |
2020 YoY |
|---|---|---|---|---|
| 1 | UK |

|
32,674 | 969.9 |
| 2 | US |

|
22,605 | 21.1 |
| 3 | Switzerland |
|
7,610 | 704.4 |
| 4 | Singapore |
|
5,462 | 98.3 |
| 5 | China |

|
1,434 | -31.5 |
| 6 | France |
|
1,398 | -19.5 |
| 7 | Hong Kong |
|
1,239 | -45.4 |
| 8 | Netherlands |
|
1,215 | — |
| 9 | Thailand |
|
1,080 | -4.8 |
| 10 | Germany |
|
819 | 235.7 |
| — | World | — | 70,581 | 61.8 |
As for Asia, where FDI to Japan has been on the rise in recent years, Singapore rose 98.3% year on year to 500 billion yen, but other major investor countries and regions saw declines across the board, including 31.5% down in China and 45.4% down in Hong Kong.
Non-manufacturing sector accounted for the majority of FDI flow to Japan by industry
According to the statistics for FDI by industry, FDI flow to Japan fell 26.8% from the previous year to 1.1 trillion yen in 2020, the first year-on-year decline in three years since 2017. The non-manufacturing sector accounted for the majority with 1.1 trillion yen (96.8% of the total), and the manufacturing sector with 0.03 trillion yen (3.2% of the total) (Chart 1-24).
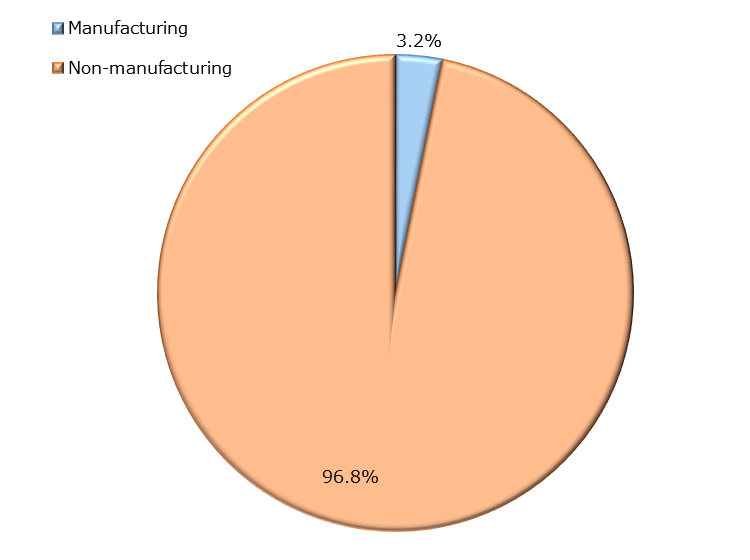
Note: Based upon different principles from statistics for FDI by region.
Source: "Balance of Payments" (MoF, BoJ)
In terms of specific industries, the financial and insurance industry accounted for the largest share at 1.2 trillion yen, down 3.7% year on year, overwhelming other industries. It was about six times as much as the transportation equipment industry, which accounted for the next largest share (200 billion yen, down 18.4% YoY) (Chart 1-25). Looking at investment by country in the financial and insurance industry, the U.S. saw a 40.5% year-on-year decline to 700 billion yen, but Singapore nearly tripled its investment from the previous year to 400 billion yen. In addition, there was an increase in investment from European countries, resulting in an overall investment amount at the same level as the previous year. In the manufacturing industry, electrical machinery, which usually has a relatively large value, fell 90.4% year on year to 30 billion yen, and chemicals and pharmaceuticals saw a net withdrawal of 200 billion yen, constraining the overall figure.
| Ranking | Change in Ranking | Sector |
2020 YoY |
Share |
|---|---|---|---|---|
| 1 | Finance&insurance | 12,445 | -3.7 | 113.7 |
| 2 | Transportation Equipment | 1,992 | -18.4 | 18.2 |
| 3 | Services | 1,950 | 38.1 | 17.8 |
| 4 | Electric machinery | 325 | -90.4 | 3.0 |
| 5 | Transportation | 256 | 11.5 | 2.3 |
| 6 | General Machinery | 254 | — | 2.3 |
| 7 | Glass and ceramics | 243 | — | 2.2 |
| 8 | Petroleum | 77 | — | 0.7 |
| 9 | Teitle | 40 | 44.8 | 0.4 |
| 10 | Iron, non-ferrous&metals | 35 | -70.2 | 0.3 |
| — | Chemistry, Pharmaceutical | -2,227 | — | — |
| — | Wholesale, retail business | -4,004 | — | — |
JETRO Invest Japan Report 2021
Chapter1. Macroeconomic and Inward/Outward Foreign Direct Investment Trends in the World and Japan
-
Section1.
-
Section2.
Chapter2. Japan's Business Environment and Foreign-Affiliated Companies
-
Section1.
-
Section2.
-
Section3.
Chapter3. JETRO's Efforts to Promote Investment in Japan
-
Section1.
-
Section2.
Contact Us
Investing in and collaborating with Japan
We will do our very best to support your business expansion into and within Japan as well as business collaboration with Japanese companies. Please feel free to contact us via the form below for any inquiries.
Inquiry FormJETRO Worldwide
Our network covers over 50 countries worldwide. You can contact us at one of our local offices near you for consultation.
Worldwide Offices