


JETRO Invest Japan Report 2023
Chapter2. Trends in Inward FDI in Japan Section 3. Trends in Inward FDI to Japan by Industry
1. Flow
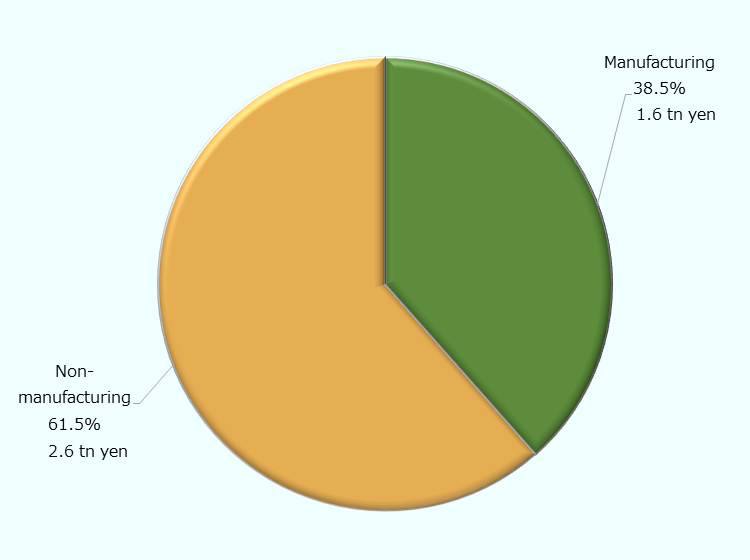
According to the statistics for FDI in Japan by industry based on the directional principle in 2022, FDI flow to Japan in total increased by 14.8% from the previous year to 4.3 trillion yen and marked a record high. In the manufacturing sector, the growth slowed slightly to 1.6 trillion yen (down 8.7% from 2021, or 38.5% of the total) due to the reversal of the sharp increase in 2021 (up 597.4% from 2020), while the non-manufacturing sector showed remarkable growth, reaching 2.6 trillion yen (up 36.8% from 2021, or 61.5% of the total) (Chart 2-7). Looking at the detailed industry sectors, the finance and insurance sector was the largest at 1.2 trillion yen despite a 2.2% decrease from the previous year, followed by the transportation sector at 0.7 trillion yen, up 232.0% from the previous year. Also, in the electrical machinery and equipment sector (up 80.9% from the previous year), which ranked third, there was a project to establish a Japanese subsidiary of a Korean EV battery material manufacturer (Chart 2-8).
Note: This is based on the directional principle and different from that of the statistics by country/region(asset and liability principle).
Source: "Balance of Payments" (MOF, BOJ)
| Ranking | Sector | 2022 | 2022 Growth rate (YoY) |
|---|---|---|---|
| 1 | Finance and insurance | 11,649 | -2.2 |
| 2 | Transportation | 7,305 | 232.0 |
| 3 | Electric machinery | 5,049 | 80.9 |
| 4 | Iron, non-ferrous, and metals | 3,699 | 4,592.7 |
| 5 | Chemicals and pharmaceuticals | 3,533 | -77.7 |
| 6 | Communications | 3,193 | 2.5 |
| 7 | Transportation equipment | 3,100 | * |
| 8 | Services | 1,675 | 118.1 |
| 9 | General machinery | 734 | * |
| 10 | Wholesale and retail | 624 | * |
| — | Construction | -52 | — |
| — | Petroleum | -186 | — |
2. Stock
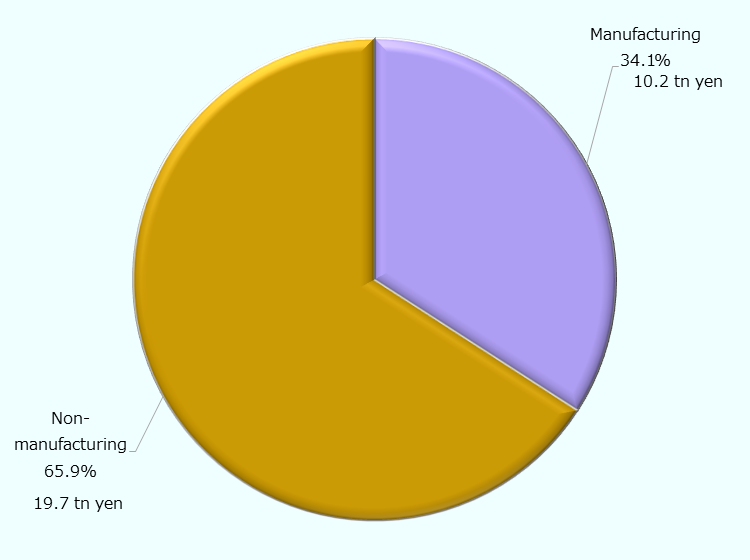
At the end of 2022, the FDI stock in Japan by industry (directional principle) was 29.9 trillion yen in total, up 8.6% from the previous year. Looking at the stock by Industry, the manufacturing industry accounted for 10.2 trillion yen (up 9.2% year-on-year, 34.1% of the total), while the non-manufacturing industry accounted for 19.7 trillion yen (up 8.2% year-on-year, 65.9% of the total) (Chart 2-9). As for the detailed industry sectors, the finance and insurance sector was the largest, increasing 7.0% from the previous year to 11.8 trillion yen (39.4% of the total). This was followed by transportation equipment at 3.1 trillion yen (10.3% of the total), up 8.5% from the previous year. Notable year-on-year growth rates were 358.2% for Iron, non-ferrous and metals, with a value of 0.5trillion yen and 1.2 trillion yen for transportation (up 148.7% year-on-year) (Chart 2-10). On the other hand, the wholesale trade/retail trade fell 76.3% year-on-year to 0.1 trillion yen (0.4% of the total).
Source: "International Investment Position of Japan"(MOF, BOJ)
| Ranking | Sector | Stock | Growth rate (YoY) | Ratio |
|---|---|---|---|---|
| 1 | Finance and insurance | 117,784 | 7.0 | 39.4 |
| 2 | Transportation equipment | 30,730 | 8.5 | 10.3 |
| 3 | Chemicals and pharmaceuticals | 29,020 | -10.2 | 9.7 |
| 4 | Communications | 22,816 | -2.7 | 7.6 |
| 5 | Electric machinery | 22,305 | 34.3 | 7.5 |
| 6 | Services | 16,366 | 17.0 | 5.5 |
| 7 | Transportation | 12,391 | 148.7 | 4.1 |
| 8 | General machinery | 5,849 | -1.9 | 2.0 |
| 9 | Real estate | 4,752 | 4.0 | 1.6 |
| 10 | Iron, non-ferrous and metals | 4,623 | 358.2 | 1.5 |
| — | Others | 32,312 | -5.3 | 10.8 |
| — | Total | 298,950 | 8.6 | 100.0 |
JETRO Invest Japan Report 2023
-
Section1.
-
Section2.
-
Section3.
-
Section4.
-
Section1.
-
Section2.
-
Section3.
-
Section4.
-
Section5.
-
Section6.
-
[Column 1]
-
[Column 2]
-
[Column 3]
-
Section1.
-
Section2.
-
Section3.
-
Section4.
-
Section5.
-
Section6.
-
Section7.
-
Section8.
-
Section9.
-
Section10.
Contact Us
Investing in and collaborating with Japan
We will do our very best to support your business expansion into and within Japan as well as business collaboration with Japanese companies. Please feel free to contact us via the form below for any inquiries.
Inquiry FormJETRO Worldwide
Our network covers over 50 countries worldwide. You can contact us at one of our local offices near you for consultation.
Worldwide Offices