


JETRO Invest Japan Report 2022
Chapter2. Business Operations of Foreign-affiliated Companies in Japan Section1. Outline of Foreign-affiliated Companies
1. Survey on Business Operations of Foreign-affiliated Companies in Japan
This questionnaire survey was administered to 6,582 foreign-affiliated companies in Japan during the period from September to October 2021, receiving responses from 1,315 companies (valid response rate: 20.0%).
Regarding the industry breakdown of respondents, 15.0% were in manufacturing, 38.6% in wholesale trade/general trade, 3.8% in retail trade, and 30.3% in services and others. By country/region of the foreign parent company, Europe accounted for 39.8%, Asia for 34.0%, and North America for 21.2% (Chart 2-1).
| Industry of foreign parent companies | n | Propotion(%) |
|---|---|---|
| Manufacturing | 197 | 15.0 |
| Wholesale trade/general trade | 507 | 38.6 |
| Retail trade | 50 | 3.8 |
| Services and others | 398 | 30.3 |
| Industry of foreign parent companies | n | Propotion(%) |
|---|---|---|
| Large enterprises | 61 | 4.6 |
| Small and medium-sized enterprises | 1,088 | 82.7 |
| Country/region of the foreign parent company | n | Propotion(%) |
|---|---|---|
| North America | 279 | 21.2 |
 USA USA
|
264 | 20.1 |
|
Canada
|
15 | 1.1 |
| Asia | 447 | 34.0 |
|
China
|
135 | 10.3 |
|
Taiwan
|
84 | 6.4 |
|
Korea
|
81 | 6.2 |
|
Hong Kong
|
75 | 5.7 |
|
Singapore
|
42 | 3.2 |
|
Other Asia
|
30 | 2.3 |
| Europe | 523 | 39.8 |
|
Germany
|
167 | 12.7 |
|
France
|
82 | 6.2 |
|
United Kingdom
|
70 | 5.3 |
|
Switzerland
|
50 | 3.8 |
|
Netherlands
|
33 | 2.5 |
|
Other Europe
|
121 | 9.2 |
| Others | 41 | 3.1 |
2. Foreign Parent Companies Breakdown by Share Ownership, Country and Region
According to the survey on the ownership by foreign parent company, 68.1% of the respondents were 100% foreign-owned. By industry, 31.6% of the “retail trade” companies have an ownership ratio of over 50% to less than 100%, including many joint ventures (Chart 2-2). New Analysis
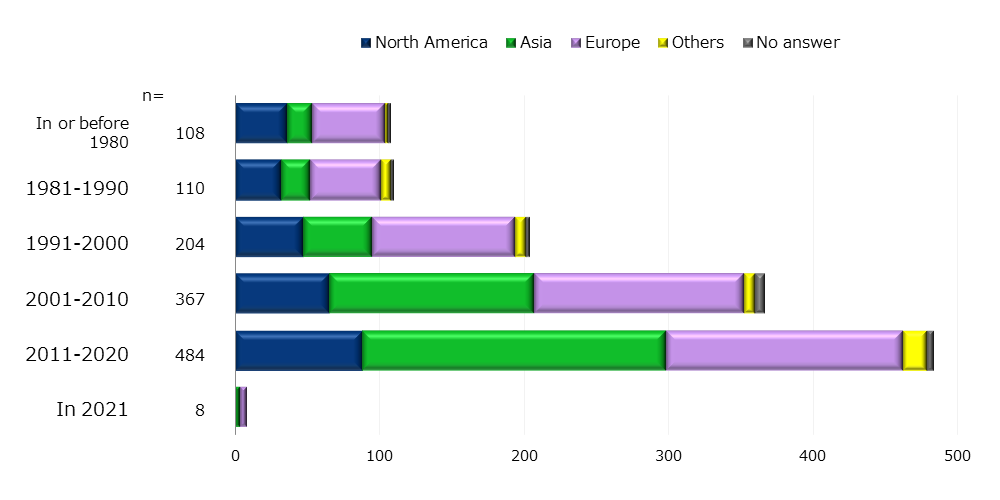
Looking at the countries and regions of foreign parent companies by the year of establishment/investment in Japan, the number of entries from Asia has increased significantly since 2001 (Chart 2-3).
| Industry | n= | 1/3 or less | Over 1/3 and less than 50% | 50% | Over 50% and less than 100% | 100% | No answer |
|---|---|---|---|---|---|---|---|
| Total | 1,315 | 3.3 | 2.4 | 2.7 | 13.1 | 68.1 | 10.3 |
| Manufacturing | 670 | 2.7 | 2.5 | 2.7 | 12.8 | 71.6 | 7.6 |
| Wholesale trade / general trade | 115 | 5.2 | 1.7 | 4.3 | 9.6 | 66.1 | 13.0 |
| Retail trade | 19 | 5.3 | 5.3 | — | 31.6 | 47.4 | 10.5 |
| Service and others | 392 | 3.8 | 2.8 | 2.6 | 14.5 | 66.8 | 9.4 |
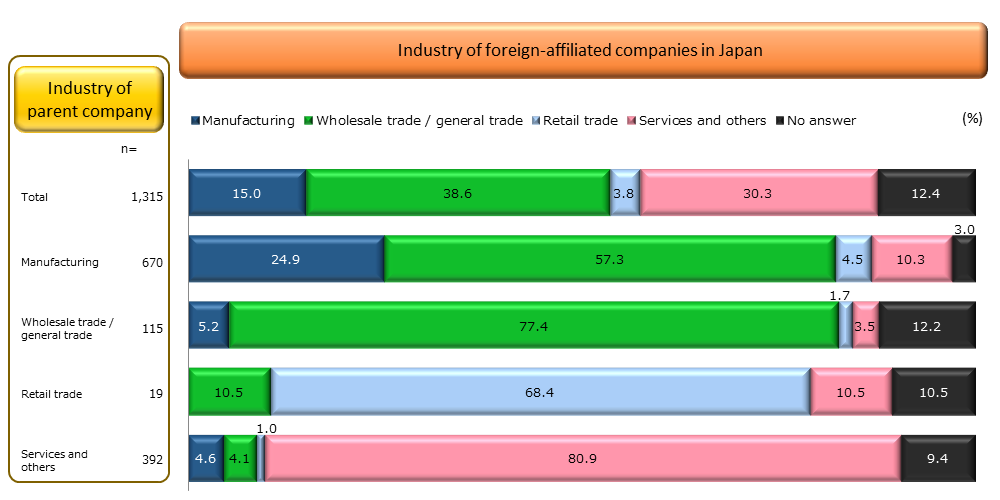
3. Industry Breakdown of Foreign Parent Companies and Foreign-affiliated Companies in Japan New Analysis
Looking at the industries of foreign parent companies, “manufacturing” accounted for the largest number of 670 companies (51.0% of the total), followed by “services and others” with 392 companies (29.8%), “wholesale trade/general trade” with 115 companies (8.7%), and retail trade with 19 companies (1.4%) (vertical axis in Chart 2-4).
57.3% of respondents have been established in Japan as wholesale trade/general trade companies, even if the foreign parent company is in the manufacturing industry (horizontal axis in Chart 2-4).
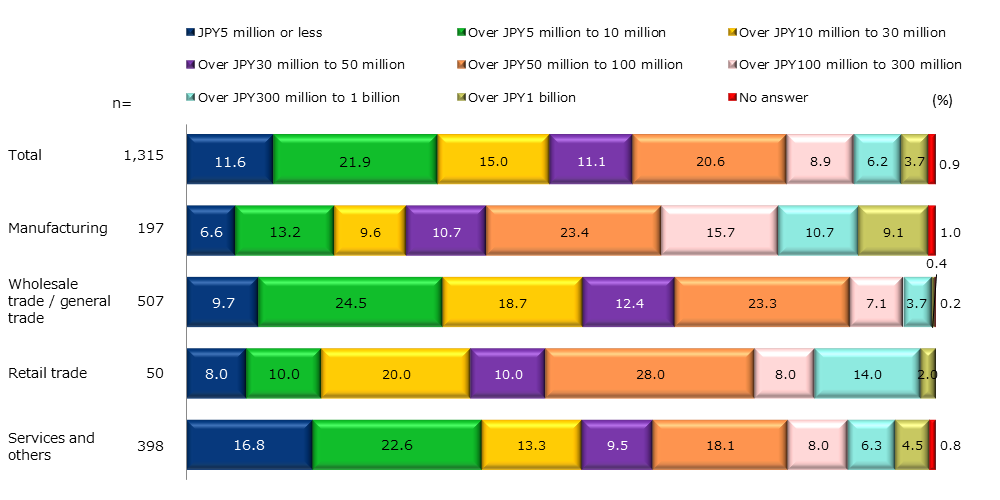
4. Size of Foreign-affiliated Companies in Japan New Analysis
The following are the survey results on the capitalization and the number of employees of the foreign-affiliated companies in Japan.
In terms of capital size, “over 5 million to 10 million yen” accounted for 21.9%, and “over 50 million to 100 million yen” for 20.6% of the total. Capital stock is relatively large among “manufacturing” and “retail trade” (Chart 2-5).
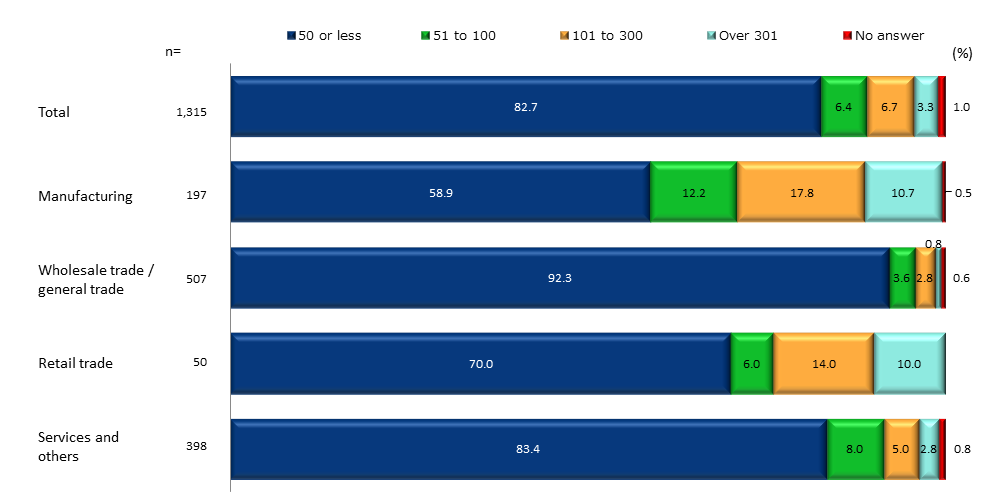
As for the number of employees, 82.7% of the total respondents have 50 or less, and 92.3% of “wholesale trade/general trade” have 50 or less (Chart 2-6).
5. Business Performance of Foreign-affiliated Companies in Japan
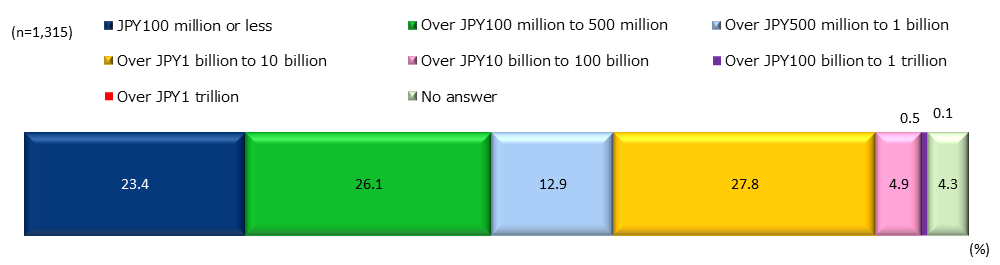
The following are the survey results on the sales and changes in sales of the foreign-affiliated companies in Japan.
In terms of sales, “from 100 million yen to 500 million yen” was the most common range recorded by 26.1% of the respondents.
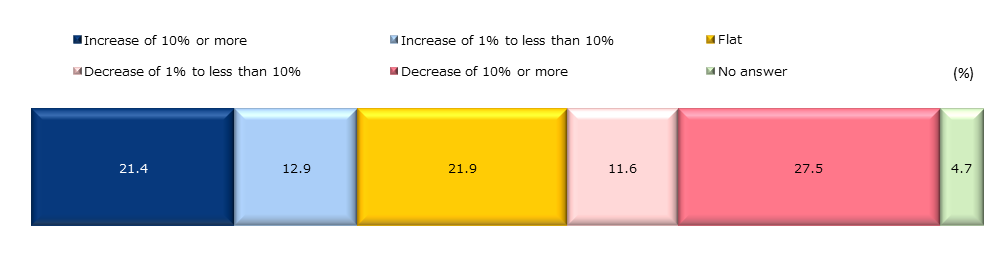
Regarding year-on-year increase/decrease in sales, "decrease of 10% or more" was the most common response at 27.5%, while "flat" and "increase of 10% or more" accounted for 21.9% and 21.4%, respectively, all above 20% range showing dispersed distribution (Chart 2-8).
JETRO Invest Japan Report 2022
-
Section1.
-
Section2.
-
Section3.
-
Section4.
-
Section5.
-
Section6.
-
Section1.
-
Section2.
-
Section3.
-
Section4.
-
Section1.
-
Section2.
-
Section3.
-
Section4.
-
Section5.
-
[COLUMN]
Contact Us
Investing in and collaborating with Japan
We will do our very best to support your business expansion into and within Japan as well as business collaboration with Japanese companies. Please feel free to contact us via the form below for any inquiries.
Inquiry FormJETRO Worldwide
Our network covers over 50 countries worldwide. You can contact us at one of our local offices near you for consultation.
Worldwide Offices