


JETRO Invest Japan Report 2022
Chapter1. FDI Trends in the World and Japan Section3. Trends in Inward FDI to Japan by Country and Region
1. Flow
Breaking down FDI flow to Japan (asset liability principle) in 2021 by region, Asia accounted for the highest amount at 2.2 trillion yen, up 98.5% from the previous year, followed by North America at 1 trillion yen, down 41.4%. Europe saw a net withdrawal of 1.1 trillion yen (Chart 1-4). As for Asia, investment from Hong Kong was the largest among the countries and regions in the world at 1.3 trillion yen, up 533.1% year-on-year, and that from Singapore was the third largest at 0.6 trillion yen, up 33.7%. Those accounted for the majority of investment from Asia (Chart 1-5). The U.S. was the second largest investor at 0.9 trillion yen, down 44.1%. Europe saw net withdrawals, with Switzerland at -0.4 trillion yen, the U.K. at -0.3 trillion yen, Sweden at -0.3 trillion yen.
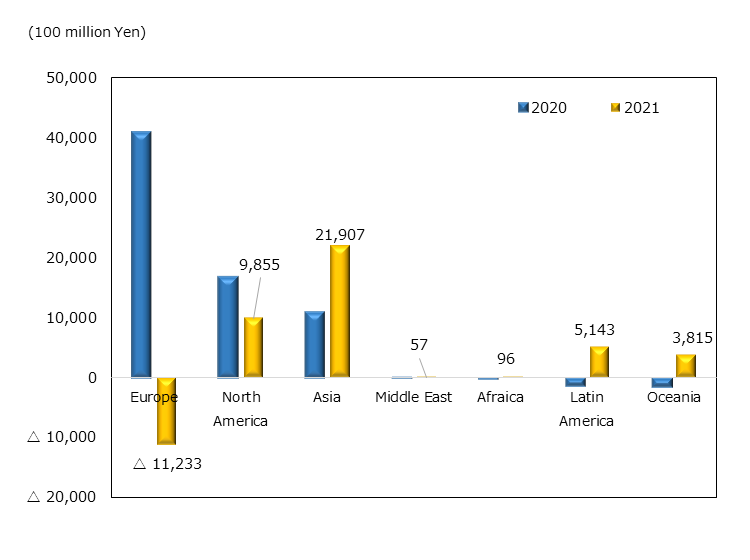
Source: "Balance of Payments" (MoF, BoJ)
| Ranking | Country/Region | 2021 |
2021 Growth rate (YoY) |
2021 Share |
|---|---|---|---|---|
| 1 | Hong Kong | 13,157 | 533.1 | 44.4 |
| 2 | US | 9,354 | -44.1 | 31.6 |
| 3 | Singapore | 6,451 | 33.7 | 21.8 |
| 4 | Cayman Isl. | 4,711 | — | 15.9 |
| 5 | Australia | 3,101 | — | 10.5 |
| 6 | Germany | 1,928 | 24.7 | 6.5 |
| 7 | South Korea | 1,378 | 62.1 | 4.6 |
| 8 | China | 880 | -43.0 | 3.0 |
| 9 | Canada | 501 | 454.7 | 1.7 |
| 10 | Belgium | 256 | 320.9 | 0.9 |
| — | World | 29,640 | -55.0 | 100 |
2. Stock
Looking at the FDI stock at the end of 2021 (asset liability principle), Europe accounted for 44.0% of the total at 17.8 trillion yen and was the largest, followed by Asia at 9.7 trillion yen (24.0%), and North America at 9.5 trillion yen (23.4%) (Chart 1-6). With increased investment from Hong Kong, the FDI stock in Japan from Asia expanded, surpassing that from North America for the first time. On the other hand, Europe fell due to declines in the stock from major countries such as Switzerland and the Netherlands. By country and region, the U.S. continued to be the largest investor at 9.2 trillion yen (22.8% of the total), followed by the U.K. at 5.7 trillion yen (14.0%) (Chart 1-7). The top 10 countries and regions were mainly taken up by Europe and Asia other than the U.S., accounting for 84.6% of the total FDI stock in Japan.
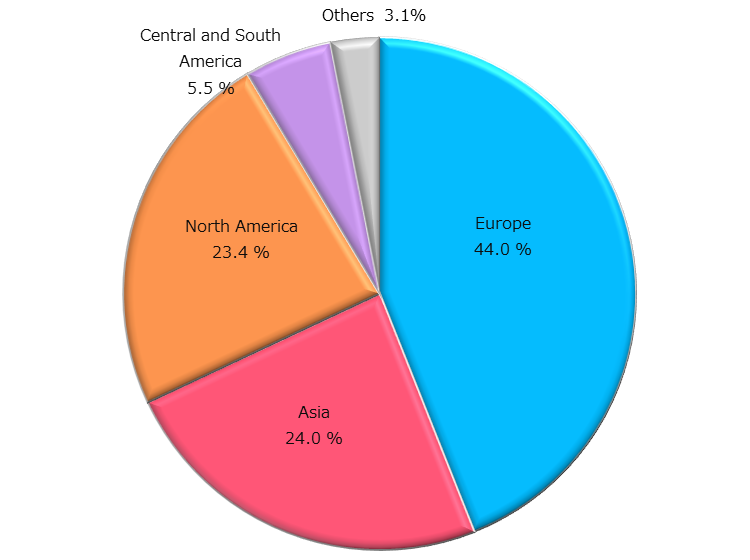
Source: "International Investment Position of Japan" (MoF, BoJ)
| Rank | Country/Region | Stock | Share |
|---|---|---|---|
| 1 | U.S. | 92,358 | 22.8 |
| 2 | U.K. | 56,562 | 14.0 |
| 3 | Netherlands | 39,236 | 9.7 |
| 4 | Singapore | 37,093 | 9.2 |
| 5 | France | 31,713 | 7.8 |
| 6 | Hong Kong | 27,598 | 6.8 |
| 7 | Switzerland | 19,253 | 4.8 |
| 8 | Cayman Isl. | 17,501 | 4.3 |
| 9 | Germany | 12,184 | 3.0 |
| 10 | South Korea | 9,299 | 2.3 |
| — | Others | 62,247 | 15.4 |
| — | Total | 405,044 | 100 |
JETRO Invest Japan Report 2022
-
Section1.
-
Section2.
-
Section3.
-
Section4.
-
Section5.
-
Section6.
-
Section1.
-
Section2.
-
Section3.
-
Section4.
-
Section1.
-
Section2.
-
Section3.
-
Section4.
-
Section5.
-
[COLUMN]
Contact Us
Investing in and collaborating with Japan
We will do our very best to support your business expansion into and within Japan as well as business collaboration with Japanese companies. Please feel free to contact us via the form below for any inquiries.
Inquiry FormJETRO Worldwide
Our network covers over 50 countries worldwide. You can contact us at one of our local offices near you for consultation.
Worldwide Offices