


JETRO Invest Japan Report 2022
Chapter1. FDI Trends in the World and Japan Section4. Trends in Inward FDI to Japan by Industry
1. Flow
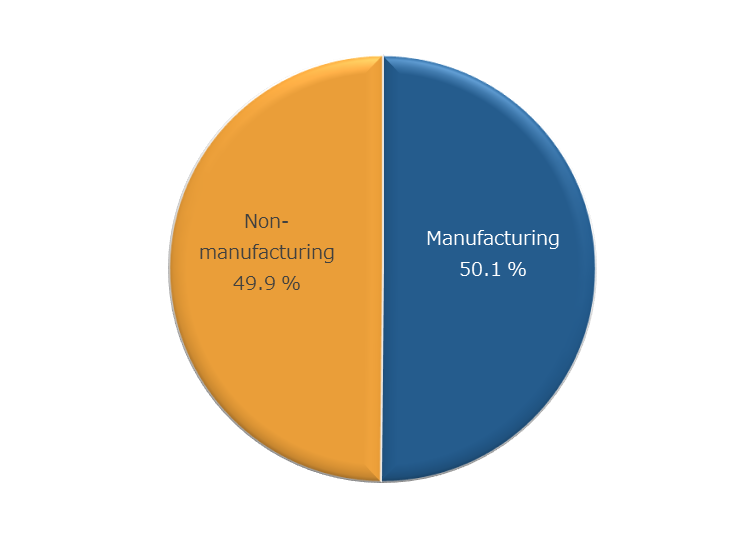
Breaking down FDI flow to Japan in 2021 by industry based on the directional principle, FDI flow to Japan increased 136.8% year-on-year to 2.7 trillion yen, surpassing the record high marked in 2016. The manufacturing industry grew significantly to 1.4 trillion yen (50.1% of the total), while the non-manufacturing industry accounted for 1.3 trillion yen (49.9%), with an almost even split between the two sectors (Chart 1-8). By industry in detail, chemicals and pharmaceuticals increased significantly from the previous year to 1.5 trillion yen, followed by finance and insurance at 0.9 trillion yen, up 25.1% (Chart 1-9). In terms of investment in the chemicals and pharmaceuticals industry by country and region, Hong Kong marked the largest flow accounting for more than 70% of the total in the industry, at 1.1 trillion yen, a 3,642.9% jump from the previous year. In this industry, investment from Switzerland was also robust and rose 24.2% to 148.6 billion yen. In the manufacturing industry, electric machinery performed well, rose 49.1% year-on-year to 200 billion yen, but transportation equipment turned negative at -300 billion yen.
Note: This is based on the directional principle and different from that of the statistics by country/region (asset and liability principle).
Source: "Balance of Payments" (MoF, BoJ)
| Ranking | Sector | 2021 |
Growth rate (YoY) |
|---|---|---|---|
| 1 | Chemicals and pharmaceuticals | 14,713 | 987.7 |
| 2 | Finance and insurance | 9,297 | 25.1 |
| 3 | Communications | 4,246 | 2,981.5 |
| 4 | Electric machinery | 2,350 | 49.1 |
| 5 | Service | 613 | -30.1 |
| 6 | Transportation | 487 | 130.6 |
| 7 | General machinery | 137 | -34.7 |
| 8 | Iron, non-ferrous, and metals | 102 | 250.0 |
| 9 | Construction | 98 | — |
| 10 | Lumber and pulp | 88 | 860.4 |
| — | Wholesale and retail | -2,403 | — |
| — | Transportation equipment | -3,293 | — |
2. Stock
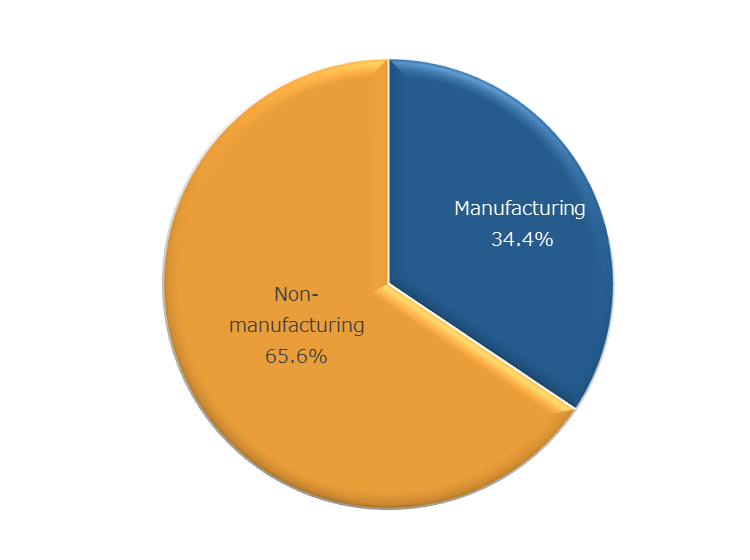
At the end of 2021, the FDI stock in Japan by industry (directional principle) was 27.2 trillion yen, up 4.8% from the previous year. The manufacturing industry accounted for 34.4%, while the non-manufacturing industry accounted for 65.6% (Chart 1-10). By sectors, finance and insurance grew by 10.4% from the previous year to 11.0 trillion yen (40.5% of the total), which was the largest (Chart1-11). Chemicals and pharmaceuticals followed this at 3.3 trillion yen (12.3% of the total), up 77.8% from the previous year, which was the highest growth rate. Meanwhile, transportation equipment saw a double-digit decrease, falling 13.2% from the previous year to 2.8 trillion yen (10.4% of the total). Electric machinery also declined to about 60% of the prior year.
Source: "International Investment Position of Japan"(MoF, BoJ)
| Rank | Sector | Stock | Share |
|---|---|---|---|
| 1 | Finance and insurance | 110,072 | 40.5 |
| 2 | Chemicals and pharmaceuticals | 33,459 | 12.3 |
| 3 | Transportation equipment | 28,327 | 10.4 |
| 4 | Communications | 23,262 | 8.6 |
| 5 | Electric machinery | 15,563 | 5.7 |
| 6 | Services | 13,957 | 5.1 |
| 7 | General machinery | 5,971 | 2.2 |
| 8 | Transportation | 4,976 | 1.8 |
| 9 | Real estate | 4,569 | 1.7 |
| 10 | Glass and ceramics | 4,433 | 1.6 |
| — | Others | 26,996 | 9.9 |
| — | Total | 271,585 | 100 |
JETRO Invest Japan Report 2022
-
Section1.
-
Section2.
-
Section3.
-
Section4.
-
Section5.
-
Section6.
-
Section1.
-
Section2.
-
Section3.
-
Section4.
-
Section1.
-
Section2.
-
Section3.
-
Section4.
-
Section5.
-
[COLUMN]
Contact Us
Investing in and collaborating with Japan
We will do our very best to support your business expansion into and within Japan as well as business collaboration with Japanese companies. Please feel free to contact us via the form below for any inquiries.
Inquiry FormJETRO Worldwide
Our network covers over 50 countries worldwide. You can contact us at one of our local offices near you for consultation.
Worldwide Offices