


JETRO Invest Japan Report 2018 (Summary) 1. Recent Situation of Inward FDI in Japan
Inward FDI stock marked a record high for four consecutive years
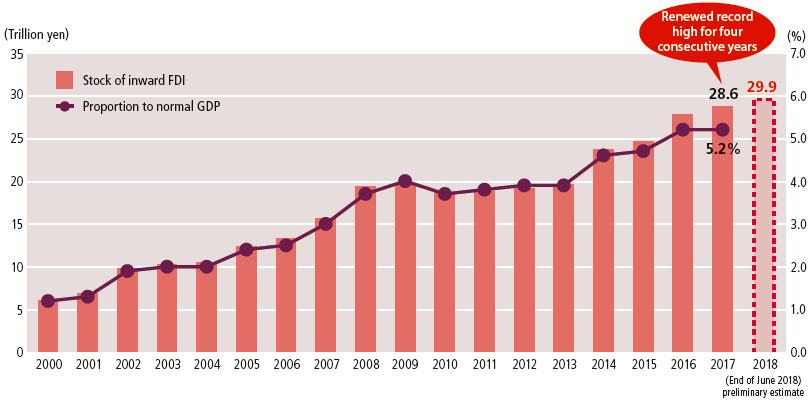
- Japan’s inward FDI stock at the end of 2017 was 28.6 trillion yen (up 323 billion yen from the previous year), renewing a record high for four consecutive years.
- Inward FDI stock as a proportion to nominal gross domestic product (GDP) remains 5.2%.
- Inward FDI stock at the end of June 2018 (preliminary estimate) marked 29.9 trillion yen (announced in September 2018 by the Ministry of Finance).
Inward FDI stock and its proportion to nominal GDP (based on Sixth Edition of the IMF's Balance of Payments and International Investment Position Manual (BPM6))
[Source] "International Investment Position of Japan" (Ministry of Finance and Bank of Japan), "National Accounts of Japan" (Japan Cabinet Office)
By region, ten-fold increase in FDI stock from Asia since 2000
- Europe accounted for 49.4% (about 14.1 trillion yen) of inward FDI stock in Japan, contributing the largest share, followed by North America, accounting for 24.0% (6.9 trillion yen), and Asia, 18.6% (5.3 trillion yen).
- FDI stock from Asia has risen by a factor of 10.3 compared to 2000 levels, making it the fastest growing player and third largest investor in Japan following Europe and North America.
Share of inward FDI stock in Japan by region
(as of end of 2017)

[Source] "International Investment Position of Japan" (Ministry of Finance and Bank of Japan)
Inward FDI stock in Japan by country/region Top 10
(as of end of 2017)
| Rank | Country/region | Stock (Billion yen) | Ratio (%) |
|---|---|---|---|
| 1 | US | 6,670 | 23.4 |
| 2 | Netherlands | 4,595 | 16.1 |
| 3 | France | 3,500 | 12.3 |
| 4 | Singapore | 2,542 | 8.9 |
| 5 | UK | 1,721 | 6.0 |
| 6 | Cayman Islands | 1,414 | 5.0 |
| 7 | Switzerland | 1,259 | 4.4 |
| 8 | Hong Kong | 960 | 3.4 |
| 9 | Germany | 894 | 3.1 |
| 10 | Luxembourg | 857 | 3.0 |
Changes in inward FDI stock in Japan by region (indexed to end of 2000 level = 100)
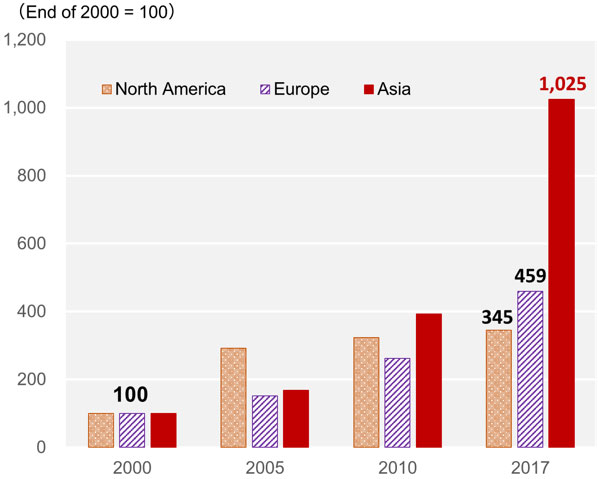
[Note] Based on BPM6 (figures before 2014 have been converted by JETRO from BPM5-based to BPM6-based)
[Source] “International Investment Position of Japan” (Ministry of Finance and Bank of Japan)
Inward FDI saw a sixth successive year of excess inflow, marking fourth highest record
- 2017 saw net flow of inward FDI in Japan of 2.12 trillion yen, the sixth successive year of surplus.
- By region, Asia recorded inward FDI in Japan at 632 billion yen, North America 646.5 billion yen and Europe 505.3 billion yen.
- Inward FDI in Japan from January to June 2018 shows at 1.40 trillion yen, up around 30% in annual terms.
Changes in net flow of inward FDI into Japan by country/region
(Billion yen) (-: no data is available)
| Country/region | 2014 | 2015 | 2016 | 2017 | 2018 | |
|---|---|---|---|---|---|---|
| Jan-Jun |
Year-on-year growth (%) |
|||||
| Asia | 678 | 677 | 933 | 632 | 328 | △ 26.7 |
 China China
|
80 | 77 | △ 11 | 108 | 23 | 327.8 |
|
Hong Kong
|
228 | 119 | 159 | △ 27 | 49 | 361.7 |
|
Taiwan
|
126 | 85 | 256 | 84 | 24 | △ 37.4 |
|
Korea
|
70 | 113 | 65 | 109 | 66 | 29.3 |
|
ASEAN
|
174 | 281 | 465 | 357 | 167 | △ 51.2 |
|
Singapore
|
144 | 229 | 394 | 385 | 58 | △ 84.7 |
|
|
759 | 524 | 689 | 647 | 24 | △ 92.6 |
|
US
|
758 | 527 | 688 | 657 | 20 | △ 94.0 |
|
|
73 | △ 240 | 181 | 298 | 553 | 240.8 |
| Oceania | 62 | △ 77 | 88 | 28 | 236 | - |
| Europe | 441 | △ 284 | 2,406 | 505 | 120 | △ 4.0 |
|
EU
|
376 | △ 263 | 2,300 | 348 | 104 | 2.6 |
| World | 2,075 | 627 | 4,317 | 2,118 | 1,403 | 31.6 |
Changes in quarterly net flow of inward FDI into Japan
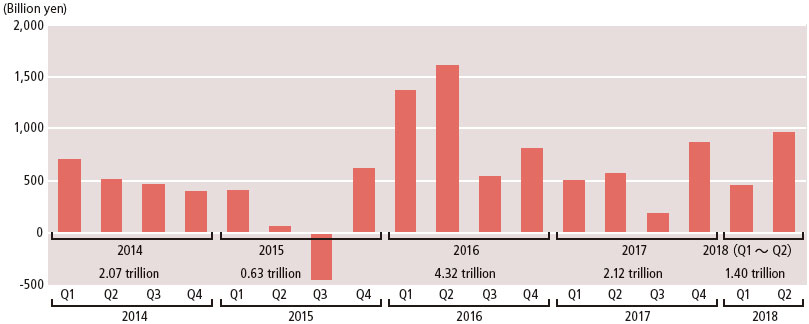
[Note] Q1 = Jan-Mar, Q2 = Apr-Jun, Q3 = Jul-Sep, Q4 = Oct-Dec
[Source] "Balance of Payments" (Ministry of Finance and Bank of Japan)
The advent of new fields of investment such as the sharing economy
- Investment from Asia expanded in B to C sectors including the sharing economy.
- Investment from North America was characterized by US investment funds’ active deals and so-called IT platformers and startup incubators.
- Europe continues to provide investment in the manufacturing sector, particularly by companies using IT, and in the FinTech sector.
Major inward M&A deals in Japan from 2017 to first half of 2018
(-: no data is available)
| Date effective | Target | Target Industry | Acquirer |
Acquirer Parent country/region |
Acquirer Industry |
Value (billion yen) |
|---|---|---|---|---|---|---|
| 2017 May | Calsonic Kansei | Autoparts | Kohlberg Kravis Roberts (KKR) | US | Investment firm | 498.2 |
| 2017 Apr | USJ | Leisure | Comcast NBC Universal | US | Media | 254.8 |
| 2017 Jul | Hitachi Koki | Machinery | Kohlberg Kravis Roberts (KKR) | US | Investment firm | 147.1 |
| 2017 Mar | Accordia Golf | Leisure | MBK Partners | Korea | Investment firm | 85.3 |
| 2017 Sep | Coca-Cola Bottlers Japan | Beverage | Coca-Cola Japan | US | Beverage | 54.1 |
| 2017 Aug | TASAKI | Retail (Jewel) | MBK Partners | Korea | Investment firm | 31.5 |
| 2017 Apr | AIG Fuji Life Insurance | Finance | FWD Group | Hong Kong | Finance | 39.2 |
| 2018 Jun | Toshiba Memory | Electronics | Bain Capital (US), SK hynix (Korea) and others | - | Investors group | 2000.0 |
| 2018 Apr | Takata | Transportation equipment | Joyson Electronics | China | Transportation equipment | 175.0 |
| 2018 Mar | ASATSU-DK | Advertising agency | Bain Capital | US | Investment firm | 152.3 |
2018

-
1. Recent Situation of Inward FDI in Japan
 (1.7MB)
-
2. Toward Improvement of Business Environment
(469KB)
-
3. Trend in Inward FDI in Japan – Foreign Investment Contributing to the Emergence of Innovation
(1.6MB)
-
4. Perception of the Business Environment in Japan among Foreign-affiliated Companies
(440KB)
-
5. JETRO Efforts to Promote Investment in Japan
(3.5MB)
Contact Us
Investing in and collaborating with Japan
We will do our very best to support your business expansion into and within Japan as well as business collaboration with Japanese companies. Please feel free to contact us via the form below for any inquiries.
Inquiry FormJETRO Worldwide
Our network covers over 50 countries worldwide. You can contact us at one of our local offices near you for consultation.
Worldwide Offices