


Chapter 1 Macroeconomic and Inward Foreign Direct Investment Trends in the World and Japan
Despite the increase in global inward FDI in 2019, up to 40% decline expected in 2020
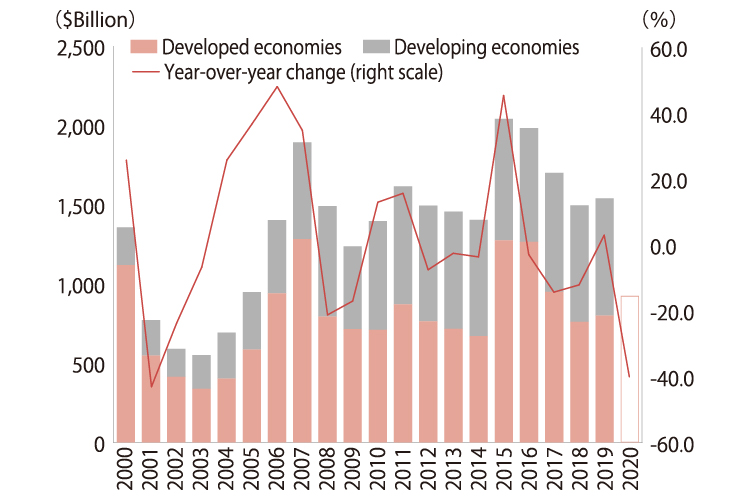
- According to United Nations Conference on Trade and Development (UNCTAD), the inward FDI in 2019 increased by 3.0% from the previous year to $1.5 trillion. Global FDI increased for the first time in four years.
Trends in Global Inward FD
-
Note:
1) The year-over-year change in 2020 is estimated to be negative 30-40%. The graph shows an assumption where FDI declines by 40% in 2020.
2) "Developed economies" is as defined by UNCTAD. The amount of inflow to developing economies is computed by subtracting that of developed economies from that of the world.
-
Source:
"World Investment Report 2020"(UNCTAD)
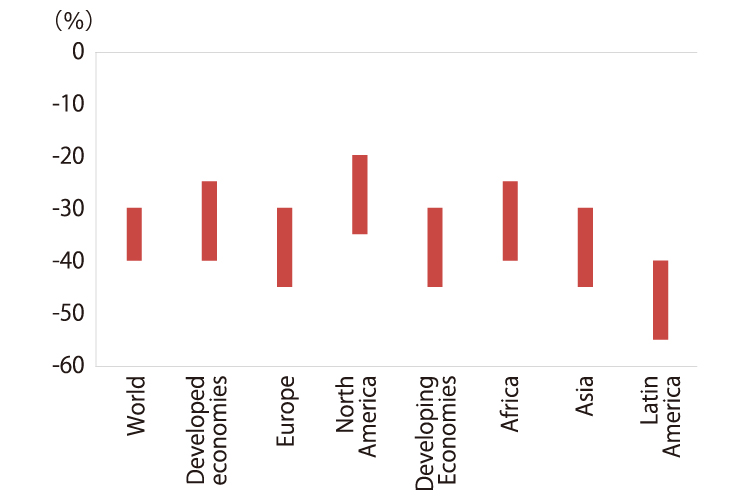
- Due to the impacts of COVID-19, global inward FDI is forecasted to decline 30 to 40 % year-over-year in 2020. Inward FDI in the first half of 2020 decreased by 49%, compared to the same period of 2019.
FDI Growth (forecast)
-
Note:
Classification of each region is as defined by UNCTAD.
-
Source:
"World Investment Report 2020" (UNCTAD)
FDI flow to Japan in 2019 was the second largest. Although the flow has been steady, close monitoring required in 2020.
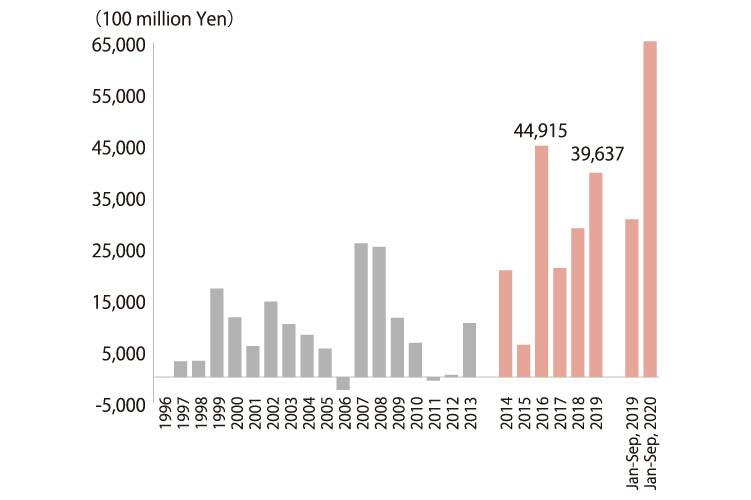
- In 2019, inward FDI to Japan increased 37.3% from the previous year to 4.0 trillion yen, the second largest since 2014, for which comparable data is available.
- Investment from the US was 1.9 trillion yen, up 141.5% from the previous year, continuing to be the largest investor by country. Investment from major Asian countries and regions remarkably increased as well.
FDI Flow to Japan
-
Note:
The figures before 2013 are calculated based upon a different principle.
-
Source:
"Balance of Payments" (Ministry of Finance, Bank of Japan)
- Although the FDI flow from January to September 2020 has increased from the same period of the previous year, close monitoring for the flow after 2020 is required, given the recent trends in statistics, such as greenfield investment.
| 2019 Ranking |
Change in |
Investor Country/ |
2019 | Share | YoY | 2020 Jan-Sep |
|---|---|---|---|---|---|---|
| 1 | → | US | 19,140 | 48.3 | 141.5 | 22,204 |
| 2 | → | UK | 3,122 | 7.9 | -35.6 | 31,577 |
| 3 | ↗ | Hong Kong | 2,519 | 6.4 | 192.9 | 1,327 |
| 4 | ↗ | Singapore | 2,141 | 5.4 | - | 3,410 |
| 5 | ↗ | China | 2,090 | 5.3 | 135.9 | 170 |
| 6 | ↘ | Cayman | 1,445 | 3.6 | -65.1 | -1,214 |
| 7 | ↗ | Luxemburg | 1,387 | 3.5 | - | -318 |
| 8 | ↘ | France | 1,370 | 3.5 | -48.0 | 1,357 |
| 9 | ↘ | Thailand | 1,135 | 2.9 | -13.9 | 1,216 |
| 10 | ↗ | Taiwan | 1,114 | 2.8 | 170.4 | 763 |
| - | - | World | 39,637 | 100.0 | 37.3 | 65,210 |
| 2019 Ranking |
Change in Ranking |
Sector | 2019 | YoY | 2020 Q1-Q2(P) |
|---|---|---|---|---|---|
| 1 | → | Finance&insurance | 8,875 | 41.8 | 3,955 |
| 2 | → | Electric machinery | 3,877 | -29.3 | 1,968 |
| 3 | ↗ | Transportation Equipment | 3,813 | 76.6 | 2,114 |
| 4 | ↘ | Chemicals&pharmaceuticals | 3,359 | 28.5 | 90 |
| 5 | ↗ | Services | 1,289 | 3827.9 | 976 |
| 6 | ↗ | Food | 610 | 556.8 | 4 |
| 7 | ↘ | Real estate | 349 | -57.3 | 619 |
| 8 | ↗ | Construction | 267 | - | -14 |
| 9 | ↘ | Transportation | 170 | 38.3 | -37 |
| 10 | ↘ | Iron, non-ferrous&metals | 109 | 52.5 | -4 |
FDI stock in Japan increased to 33.9 trillion yen at the end of 2019
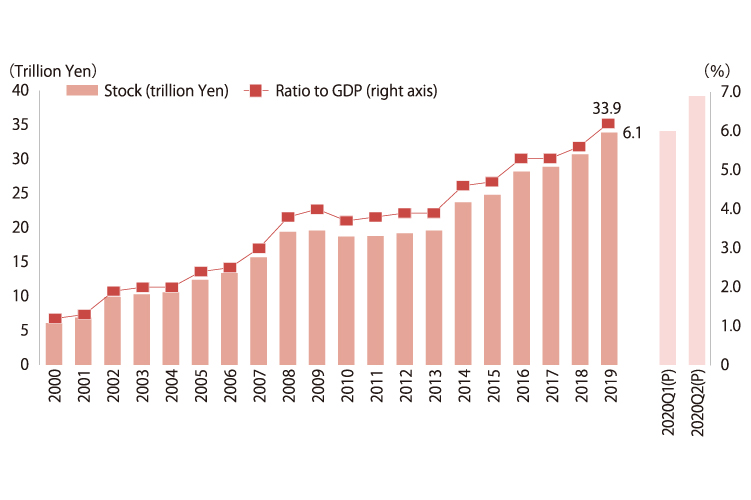
- The FDI stock in Japan at the end of 2019 reached a new high of 33.9 trillion yen, up 10.4% from the previous year. The ratio of the balance to GDP increased from 5.6% in the previous year to 6.1%. The stock at the end of the second quarter of 2020 was estimated to be 39.2 trillion yen.
FDI Stock in Japan
-
Source:
"International Investment Position of Japan" (Ministry of Finance, Bank of Japan), "National Accounts of Japan" (Cabinet Office)
- By country and region, the FDI stock of the US in 2019 was 8.0 trillion yen or 23.6% of the total, more than twice larger than France (4.0 trillion yen), which was the second largest.
| Rank | Country/Region | Stock | Share |
|---|---|---|---|
| 1 | US | 79,801 | 23.6 |
| 2 | France | 39,284 | 11.6 |
| 3 | Netherlands | 39,067 | 11.5 |
| 4 | Singapore | 35,618 | 10.5 |
| 5 | UK | 24,960 | 7.4 |
| 6 | Cayman Isl. | 19,485 | 5.8 |
| 7 | Switzerland | 14,725 | 4.3 |
| 8 | Hong Kong | 12,365 | 3.7 |
| 9 | Luxembourg | 9,727 | 2.9 |
| 10 | Germany | 9,576 | 2.8 |
| - | Others | 54,103 | 16.0 |
| - | Total | 338,711 | 100.0 |
- By industry, non-manufacturing industry accounted for 59.2%. Looking at detailed industries, the stock of finance and insurance was 9.5 trillion yen, accounting for 39.4%.
| Rank | Industry | Stock | Share |
|---|---|---|---|
| 1 | Finance&insurance | 94,995 | 39.4 |
| 2 | Transportation equipment | 35,990 | 14.9 |
| 3 | Electric machinery | 26,638 | 11.1 |
| 4 | Chemicals&pharmaceuticals | 20,161 | 8.4 |
| 5 | Communications | 15,550 | 6.5 |
| 6 | Services | 12,712 | 5.3 |
| 7 | General machinery | 5,247 | 2.2 |
| 8 | Real estate | 5,121 | 2.1 |
| 9 | Transportation | 4,079 | 1.7 |
| 10 | Glass&chemicals | 3,371 | 1.4 |
| - | Others | 17,056 | 7.1 |
| - | Total | 240,920 | 100.0 |
2020

-
1. Macroeconomic and Inward Foreign Direct Investment Trends in the World and Japan
 (1.5MB)
-
2. Japan’s Business Environment and Foreign-Affiliated Companies
(1.3MB)
-
3. Changes and Business Opportunities Brought to the Japanese Market by COVID-19
(1.3MB)
-
4. JETRO’s Efforts to Promote Investment in Japan
(1.2MB)
Contact Us
Investing in and collaborating with Japan
We will do our very best to support your business expansion into and within Japan as well as business collaboration with Japanese companies. Please feel free to contact us via the form below for any inquiries.
Inquiry FormJETRO Worldwide
Our network covers over 50 countries worldwide. You can contact us at one of our local offices near you for consultation.
Worldwide Offices