

News & Updates
FY2019 JETRO Survey on Business Conditions for Japanese Companies in Canada (30th annual survey)
Feb 28, 2020
Profitability of Japanese companies in Canada is high, but business sentiment has fallen into the negative range
JETRO has conducted a survey on the state of Japanese manufacturers and non-manufacturers operating in Canada. The results are summarized below, with corresponding page numbers from the attachment included.
| Method | Distribution of a questionnaire |
|---|---|
| Dates | From October 29, 2019 to November 29, 2019 |
| Scope | Japanese manufacturers and non-manufacturers operating in Canada 146 responses received from 178 surveys sent (response rate of 82.0%) |
| Topics |
|
Key Points Regarding the Survey Results
- The percentage of profitable Japanese companies remained above 70% for an eighth straight year since the FY2012 survey; however, the DI indicating business sentiment fell into the negative range for the first time in eight years since the FY2011 survey.
- This is our first survey in which we asked respondents about their wages and company benefits. The median values for monthly base salaries were between CAN$4,000 and CAN$7,000 (varies by occupation). As for company benefits, more than half of the respondents offer accident and sickness benefits and in-house training programs.
- With respect to changes in the trade environment such as additional tariffs, some 20% of companies reported “negative effects” partially due the imposition of additional tariffs between U.S. and Canada. Many respondents were impacted specifically by the “additional tariffs of U.S. imposed on steel and aluminum” and “Canada’s retaliatory tariffs against additional U.S. tariffs”
Note 1: The totals in the surveys in this report may not be 100 because the numbers are rounded off to the first decimal point.
Note 2: The rates are calculated based on the numbers of answers collected.
*The attached document: “FY2019 JETRO Survey on Business Conditions for Japanese Companies in Canada (30th annual survey)![]() (1.5MB)”
(1.5MB)”
Summary of Survey Results
JETRO had conducted a survey questionnaire of Japanese companies in Canada in October and November of 2019 (receiving valid answers from 146 companies), with the results showing that more than 70% of Japanese companies were profitable for an eighth consecutive year as Canadian economy stayed robust. However, the DI indicating business sentiment fell into the negative range for the first time in eight years. With unemployment remaining low, wages at Japanese companies are on the rise, with the median value of increases coming to 2.5% in 2019. The survey also showed that 20% of the respondents experienced negative effects from changes in the trade environment, such as additional tariffs.
1. Percentage of Profitable Japanese Companies Active in Canada and Their Business Sentiment DI
The percentage of profitable Japanese companies active in Canada came to 77.1%, the highest since 2000 and remaining above 70% for an eight straight year since the FY2012 survey. Meanwhile, the DI indicating business sentiment was at -2.1 points, falling into the negative range for the first time in 8 years since the FY2011 survey.
- For 2019, 77.1% of the respondents expect to generate positive operating profit (p.8). With the robust Canadian economy, the percentage of companies that responded with expectations of positive operating profit (profitability ratio) increased 2.3 percentage points from the previous year (74.8%). The profitability ratio remained above 70% for an eighth straight year since the fiscal 2012 survey, and marked the highest since 2000 (81.6%). By industry, food/agricultural products, plastic products (100%) and sales companies (88.0%) recorded high profitability ratios.
Figure1. Trends in Percentage of Profitable Japanese Companies Active in Canada and Their Business Sentiment DI (1998-2020)
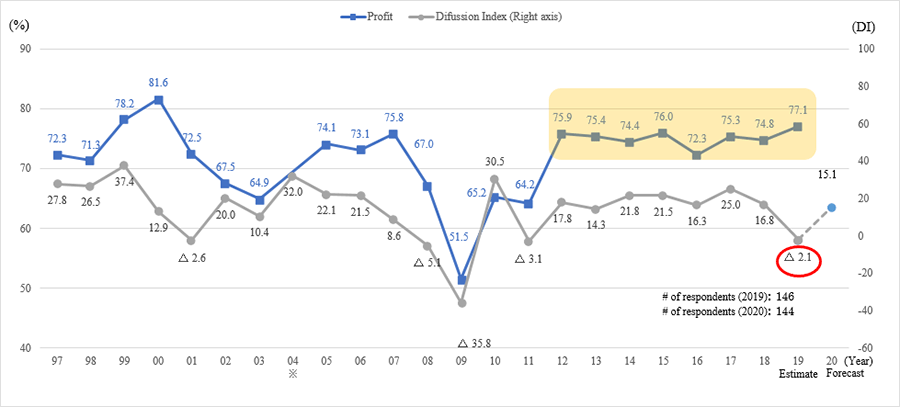
Note: No survey was conducted in 2004. DI for 2004 was the estimate from the 2003 survey.
Source: JETRO
- Meanwhile, the DI indicating business sentiment for 2019 (obtained by subtracting the percentage of companies expecting a “decrease” in operating profits vs. last year from the percentage of those expecting an “increase”) came to -2.1, falling significantly from last year’s figure of 16.8 (p.9). The industries of electrical machinery, electronic devices and plastic products recorded DI of -80.0, sliding deep into negative territory.
- Among factors for forecasting a drop in the 2019 operating profit, top answers included “sales decrease in local market” (55.1%), as well as cost increases, such as “increase of labor costs”(36.7%) and “increase of procurement costs”(30.6%).
2. Wages and Benefits
This is our first survey that looks at the kinds of benefits companies provide and their wages. The median values for base salaries (monthly base) ranged from CAN$4,000 to CAN$7,000. The average wage increase across all occupations was 2.5%.
- The median value for base salaries (monthly basis) by occupation in 2019 was as follows: at factories, the pay for production managers (section chiefs of production management departments) was CAN$7,000; mechanical engineers (technical positions for designing, manufacturing and managing machines and equipment), CAN$5,267; operators (job types engaged in machine operation in the manufacturing process), CAN$4,000 (p.20). Among office positions, the pay for general administration section chiefs (section chiefs of general affairs departments) was CAN$6,500, and general clerks (general office workers), CAN$4,000.
Figure2. Wages (Monthly Base Salaries): Median Values
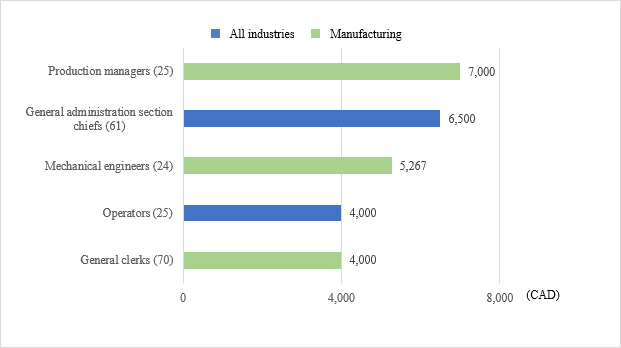
Note: Production managers, mechanical engineers, and operators are answered by manufacturing companies.
Source: JETRO
- The median increase across the averages of all occupations for fiscal 2019 was 2.5%, with the fiscal 2020 rate forecast at 2.5% as well.
- Among the benefits offered, “accident and sickness benefits” (59.0%), “in-house training program” (56.7%) and “paid maternity & paternity/child-care leave” (47.8%) ranked high (p.19).
3. Effects of Changes in the Trade Environment
Some 20% of companies reported “negative effects," with more than half answering that the main area where negative effects are being felt was “import/procurement cost.” The specific policies having an impact were said to be “additional tariffs of U.S. imposed on steel and aluminum (Section 232 of the Trade Expansion Act in 1962” and “Canada’s retaliatory tariffs against additional U.S. tariffs.” The responses showed that Japanese companies operating in Canada were affected more by the retaliatory additional tariffs between U.S. and Canada than those between U.S. and China.
- In terms of the impact felt at present from the changes in the trade environment, 38.1% reported experiencing “no impact,” followed by 29.1% that were “not sure,” while 22.4% reported experiencing “negative effects” (p.28). The main area where negative effects are being felt were said to be “import/procurement cost” (53.3%), “sales in Canadian market” (33.3%) and “production cost” (20.0%).
Figure 3 Current Impact Due to Changes in the Trade Environment
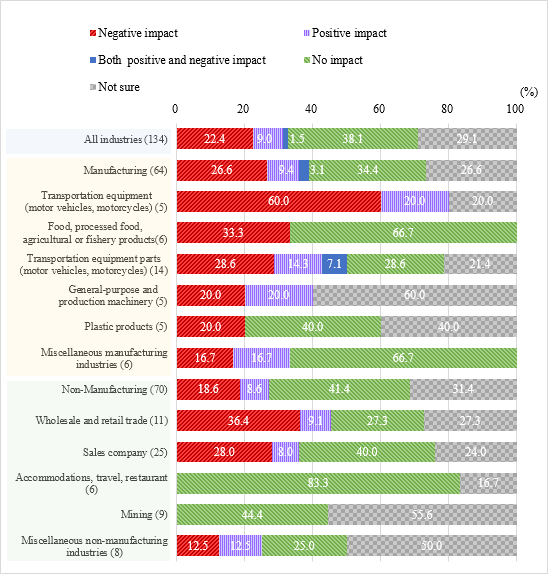
Note: Graph lists only those industries in which valid responses were received from 5 or more companies.
Source: JETRO
- Asked which specific policies were having an impact on their business, 57.7% of respondents cited “additional tariffs of U.S. imposed on steel and aluminum (Section 232 of the Trade Expansion Act in 1962,” followed by 34.6% that answered “Canada’s retaliatory tariffs against additional U.S. tariffs,” indicating that the effects of additional tariffs between U.S. and Canada were greater than the retaliatory tariffs between U.S. and China (p.29).
(Note) The U.S. imposed additional tariffs on Canadian iron, steel and aluminum under Section 232 of the Trade Expansion Act between June 1, 2018 to May 19, 2019; Canada imposed retaliatory tariffs against the U.S. between July 1, 2018 to May 19, 2019.
Other Notable Trends
- Management challenges: Labor costs (including salaries and bonuses) of employees the top factor for increased costs
In terms of management challenges (factors for increased costs), “labor costs (including salaries and bonuses)” emerged at the top at 60.9%, up 6.0 points from the previous year (54.9%), followed by “recruiting workers (regular workers and engineers)” at 53.6% (p.17). The unemployment rate has remained low (in the 5% range since September 2018) in Canada, making recruiting difficult for Japanese companies as well.
- Procurement from Asia grew, particularly from Japan
In terms of procurement sources for raw materials and parts, procurement from within Canada (procurement rate 31.5%) and within the NAFTA region (U.S. and Mexico: total 24.6%) decreased from the previous year (36.1% and 66.1%), while procurement from Asia increased (p.15). In particular, procurement from Japan grew to 22.6%, up 4.6 points from the previous year (18.0%). Procurement from China, ASEAN, and South Korea/Hong Kong/Taiwan came to 8.2%, 4.4%, and 4.3%, respectively, all increasing year-on-year.
-
Mari Fujii, Takashi Nakamizo, and Hiroyuki Kaino
Americas Division, Overseas Department, JETRO
Tel: +81-3-3582-5545