


The tourism industry, one of the key industries driving the Japanese economy, is growing rapidly as the number of foreign visitors and inbound consumption increases. While its abundant tourism resources are attracting worldwide attention, labor shortages are an issue, and thus foreign companies are expected to enter the industry.
Tourism and Hospitality
Attractive Markets

⑴ Travel Tech: Gaining Attention Due to the Promotion of Digital Transformation and Regional Tourism
Against the backdrop of the government promoting digital transformation and the recovery of the tourism industry, there is increasing attention on the travel tech market (using the latest IT technology to reduce the hassle and ensure a seamless experience for travelers) 34. Among these, the online travel agent (OTA) market is particularly significant.
In FY 2022, the domestic market size for consumer e-commerce in the travel services sector reached 15.54 billion USD * (2.4 trillion JPY) (68.0% more than the previous year).35 In addition, 85% of foreign tourists arrange round-trip air and ship tickets and accommodation on their own, and 78% book tour services and round-trip air and passage tickets through the website.36 As personal travel arrangements through websites become mainstream, OTAs will increase their presence.
Moreover, in the OTA market, there are various examples of collaboration between foreign companies and Japanese companies, including collaboration between overseas OTA and Japanese local governments and destination management organizations (DMOs), as well as between companies (Figure 8). As the number of online travel arrangements increases, services incorporating various industries and target groups are being developed, such as offering attractions, as well as booking and payment services for airlines, restaurants, hotels, and taxis to foreign tourists. The demand for OTA services is expected to continue to meet various needs and interests. Many Japanese companies are likely to seek collaboration with overseas companies, making this a promising opportunity for foreign companies as well.
Figure 8: Examples of collaboration between Japanese and overseas companies in Travel Tech
| Japanese company/OTA* | Overseas company/OTA* | Collaboration details |
|---|---|---|
| Osaka Convention & Tourism Bureau |
Fliggy (Chinese OTA) |
Attract Chinese tourists through the development and sale of travel services unique to Osaka, digital marketing, and destination branding |
| Yokohama City Visitors Bureau |
Expedia, Hotels.com (Both U.S OTAs) |
Sales and promotional activities of travel services targeting foreign visitors to Japan |
| Izu Peninsula Geopark and Tourism Bureau |
KKday (Taiwanese OTA) |
Promote tourism and industry on the Izu Peninsula |
| Japan Airlines |
Tencent (Chinese IT company) |
Develop a mini-program that allows users to book and purchase airline tickets through WeChat, a social media app operated by Tencent |
|
Ikyu (Japanese OTA) |
My Real Trip (Korean Travel App) |
Provide Japanese restaurant reservation service |
|
SEIKO SERVICE & ENGINEERING (Japanese IT Company) |
China Mobile International (Chinese OTA) |
Strategic partnership agreement with JegoTrip, a comprehensive travel and life service app |
Also, as sustainable tourism in regional areas is becoming more important, there is a trend to address the challenges faced by the regional tourism industry through travel tech.
For example, Tourism MaaS (a service that optimally combines multiple public transportations and other transportation services in response to the needs of travelers and uses ICT to conduct search, reservation, payment, etc, in a single operation) is gaining attention as a solution to accessibility issues in regional areas. The introduction of Tourism MaaS apps and projects is expanding in rural areas such as Izu City in Shizuoka Prefecture, Nagasaki City in Nagasaki Prefecture, and Hakuba Village in Nagano Prefecture.38 There are examples of foreign companies entering the Japanese MaaS market, such as SWAT Mobility (Singapore), which operates a ridesharing app and is conducting demonstration tests in various parts of Japan.39
Additionally, as collaborations aimed at utilizing big data are evident, business opportunities for companies providing data platforms are expanding. Taiwan established Vpon JAPAN (Japan), which maintains big data in the Asian region mainly in Taiwan, Hong Kong, and China, and TakeMe (Japan), which provides cross-border payments (cross-border QR code payments), collaborated to develop marketing services using big data.40 X-Locations (Japan), which develops platforms utilizing location information, offers services that support the attraction of foreign visitors by leveraging human mobility data from Near Intelligence (U.S).41 Asoview (Japan), which provides a reservation management system and electronic ticketing services for leisure facilities, has partnered with KlooK (Hong Kong), which operates a travel and experience platform in more than 180 countries, to help domestic leisure and tourism businesses attract tourists.42
Travel tech can be used widely, including reservation and sale of travel services such as airline tickets, hotels, and restaurants, providing highly convenient mobility for tourists, and developing promotion and reservation systems for tourist destinations, restaurants, and leisure facilities using data. It is anticipated that through government initiatives, tourists' countries/regions of origin, destinations, and purposes will be diversified, and digital transformation will be introduced. As a result, the travel tech market is going to attract increasing attention.
(2) Financial Services: Growing Demand Mainly for Cashless Payment Services for Foreign Visitors to Japan
Although the prevalence of cashless payments in Japan is not as high as in other countries, the increasing growth rate and efforts to expand these payment methods indicate strong potential for future adoption. Especially overseas companies are making a strong presence in cashless payment services for visitors to Japan, who expect the same level of payment services as their home countries and regions.
The cashless payment amount and the cashless payment ratio in final expenditures in Japan have been increasing annually, almost doubling from about 20% in 2016 to 39.3% in 2023 (Figure 9). While the ratio of cashless payments has slowed in countries where it is already widespread, such as China and South Korea, the ratio continues to rise in Japan43, and this suggests that as the cashless payment market expands, numerous business opportunities will emerge.
Figure 9: Transition in cashless payment ratio in Japan (2016-2023)
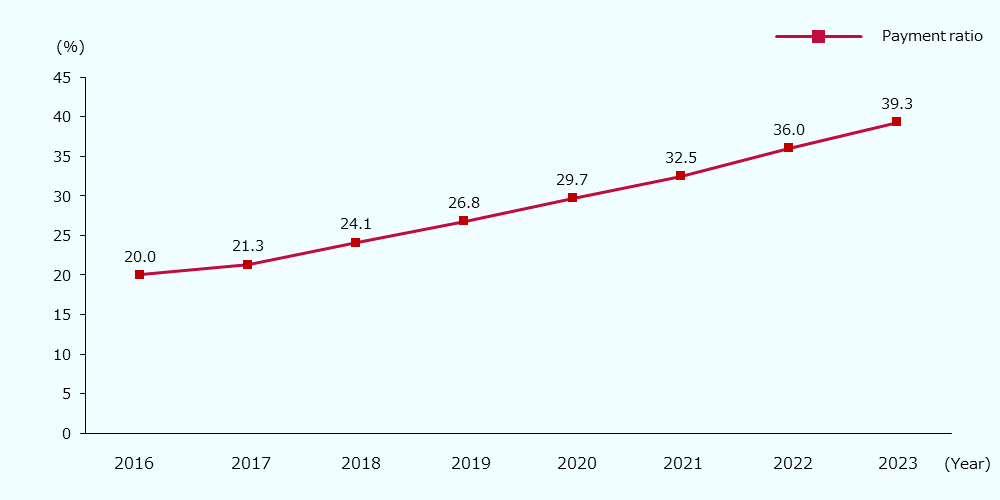
Source: Created by JETRO based on the data from Ministry of Economy, Trade and Industry (METI)44
As for the tourism industry, foreign companies are expected to enter the market and expand cashless services for foreign tourists.
The cashless payment ratio accounts for more than 50% in many countries and regions, including Taiwan, China, South Korea, U.S, Hong Kong, and Australia, which represents major inbound consumption by foreign visitors.45 Therefore, Japan, where cashless payments are still in the process of becoming widespread, seems to be being unable to fully respond to the needs of the visitors, who wish to use cashless payments as they do in their home countries or regions, potentially missing out on capturing significant inbound consumption.
To address these issues, Japanese companies providing cashless payment services and solutions are forming partnerships/collaborations with overseas companies. NETSTARS (Japan), which operates StarPay, a multi-cashless payment solution, has collaborated with QR code payment brands in 13 countries and regions, mainly in Asia and Europe.46 PayPay (Japan), a provider of QR code payment services, has collaborated with 18 QR code payment brands in a total of 10 countries and regions to strengthen inbound support.47 These payment services are highly convenient for both foreign visitors and business operators and are expected to develop as services to respond to increasing inbound tourism. As the cashless payments ratio in Japan increases and businesses providing cashless payment solutions expand, it is anticipated that further collaboration between overseas and Japanese companies will be needed.
(3) Hotel Market: Successive Expansion of Overseas Companies, Mainly Luxury Hotels
With the increase in the number of tourists, the hotel market is expanding again. Currently, the domestic hotel industry is attracting a lot of attention from overseas companies, and especially foreign luxury hotels targeting foreign visitors are making significant advances.
As of Oct. 2023, over 60% of Japan's ryokan (traditional inns) and hotels are expecting increased revenue, with 97% of all ryokan and hotels experiencing either revenue growth or stable revenue. In FY 2023, the ryokan and hotel market size on operators basis is projected to reach around 33.03 billion USD * (5 trillion JPY), which is nearly at the same level as the pre-COVID level of 32.11 billion USD * (4.9 trillion JPY) in 2019. (Figure 10).
Figure 10: Sales transition in the ryokan and hotel market (Japan FY 2018-FY 2023)
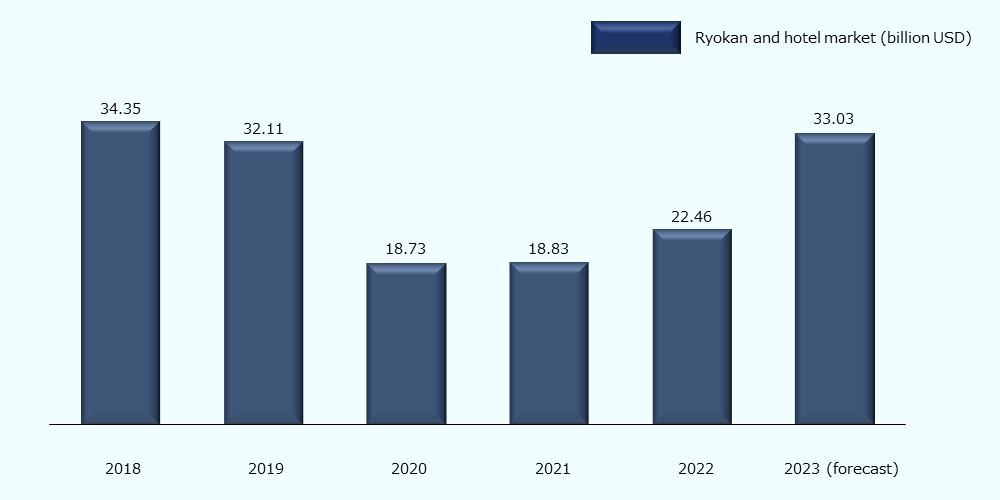
Source: Created by JETRO based on data from Teikoku Databank48
As the number of foreign visitors is increasing, overseas companies are investing in the Japanese hotel market. Especially, there are many overseas 5-star and resort hotels entering the Japanese market. Examples of foreign luxury hotel openings in recent years include JLL (U.S, scheduled to open in Tokyo in 2025)49, Capella Hotel Group (Singapore, scheduled to open in Kyoto and Osaka in 2025)50, Centara Grand Hotel (Thailand, opened in Osaka in 2023)51, Marriott International (U.S, gradually opening in 8 prefectures since 2022)52, and Accor (France, scheduled to open 23 resort hotels in Japan in 2024).53
Amid increasing demand for regional tourism, driven by government initiatives and growing interest from repeat visitors, some foreign luxury hotel companies are expanding beyond Tokyo, Osaka, and Kyoto. Marriott (U.S) opened The Ritz-Carlton Fukuoka (Fukuoka)54 and Sheraton Kagoshima (Kagoshima)55 in 2023, and Nagasaki Marriott Hotel (Nagasaki) in 202456, with plans to open another in Tottori in 2026.57 Hyatt (U.S) also plans to open a hotel in Sapporo in 2026.58
These internationally recognized foreign hotels are primarily targeting foreign visitors and high-income groups.59 Furthermore, looking at inbound travel consumption by expense category, about 35%, or 12.12 billion USD * (1.8 trillion JPY), was spent on accommodation. The share of accommodation expenses is the highest, and it is higher than the pre-COVID-19 level60, which shows that foreign hotels have been significantly benefiting from the increase in foreign visitors.
Thus, it is anticipated that demand in the hotel market will increase in response to an increase in the number of foreign visitors to Japan, leading to the development of the hotel business nationwide, including in regional areas, especially by foreign-affiliated companies operating luxury hotels.
-
*
Calculated based on the Bank of Japan exchange rate of 1 USD for 151.38 JPY (as of April 1, 2024)
References
- Official Website of Travel Technology Association (JP).
- Ministry of Economy, Trade and Industry (METI). Results of FY 2022 E-Commerce Market Survey Compiled.
- Japan Tourism Agency (JTA). Consumption trends of foreign visitors survey results & analysis of consumption trends of foreign visitors annual report 2023 (JP), pp. 13-14.
- Press releases from each company
Alibaba Japan. Fliggy signs a strategic agreement with Osaka Convention & Tourism Bureau to attract Chinese tourists (JP).
Yokohama City Visitors Bureau. Yokohama Tourism campaign conducted by major overseas online travel agents! (JP).
KKday. KKday and Izu Peninsula Geopark and Tourism Bureau
signed a comprehensive partnership agreement to promote tourism in Izu peninsula (JP).
Japan Airlines. First Japanese airlines to launch an official mini program on WeChat”, China's largest app (JP).
AFPBB News. Korean travel app partners with Japan's “Ikyu” for restaurant reservations (JP).
SEIKO ELECTRIC. Signed a memorandum of understanding with China Mobile International as a strategic partner for JegoTrip app in Japan (JP). - TOKYU. In November 2022, the digital service “Izu navi” will be launched to support tourism and workation in the Izu area! (JP).
ZENRIN. Nagasaki city's first tourism-oriented maas app "STLOCAL" launched (JP). - SWAT Mobility. SWAT Mobility provides operations app for Hakuba village’s AI on-demand ride-sharing service integrating local and tourist transportation (JP).
- TakeMe. Asia's big data company Vpon JAPAN and TakeMe, which compiles more than 100 payment types globally, formed business partnership (JP).
- X-Locations. Announcement on launch of "Traveler analysis and customer attraction package", an advertising service that supports customer attraction by analysing traveler flow data (JP).
- ASOVIEW. ASOVIEW and Klook announce strategic business partnership ~Digital transformation support for leisure facilities to attract tourists to Japan and expansion of sales in Japan~(JP).
- Payments Japan Association. Cashless roadmap 2023 (JP), p. 11.
- Ministry of Economy, Trade and Industry (METI). 2023 Ratio of Cashless Payment Among the Total Amount Paid by Consumers Calculated.
- See Note 43.
Japan Tourism Agency (JTA). Overview of the survey results (final report) on the "survey on consumption trend of foreign visitors" 2023 (JP), p. 1. - NETSTARS. Expands overseas payment services supported by "StarPay" (JP).
- PayPay. PayPay partners with 8 overseas cashless payment services in 4 countries! (JP).
- TEIKOKU DATABANK. Survey on trends in the "Ryokan and hotel industry" (FY 2023 forecast) (JP), pp. 1-2.
TEIKOKU DATABANK. Survey on trends in the "Ryokan and hotel industry" (FY 2022) (JP), pp. 1-2. - JLL. JLL supports hotel contract negotiations for Japan’s first ‘Fairmont Tokyo (JP).
- NTT URBAN DEVELOPMENT CORPORATION. Singapore-based luxury hotel “Capella” to open in Kyoto, first in Japan (JP).
NTT URBAN DEVELOPMENT CORPORATION. “Patina Hotels & Resorts” enters Japan for the first time (JP). - Centara Hotels & Resort. Construction Milestone for Hotel in Japan.
- SEKISUI HOUSE. Regional revitalization project "Trip Base Michi-no-eki Project" by SEKISUI HOUSE and Marriott (JP), pp. 1-2.
- Accor. Accor accelerates in Japan with agreement to operate 23 properties.
- Official Website of The Ritz-Carlton, Fukuoka.
- Official Website of clubMARRIOTT.
- Official Website of Marriott International.
- Kankokeizai. Marriott International to open “Luxury collection hotel” on the west side of Tottori sand dunes in 2026 (JP).
- Hyatt. Hyatt’s Growth Momentum Continues with Record Global Pipeline of 129,000 Rooms.
- See Note 53, 58.
Hotel Management International. Marriott International and HMI Hotel Group Enter Strategic Partnership. - Japan Tourism Agency (JTA). Overview of the survey results (final report) on the "survey on consumption trend of foreign visitors" 2023 (JP), p. 2.
-
Overview
Japan’s Tourism Market Strengthens With the Increase in Inbound Consumption

-
Government Initiatives
Promotion of Digitalization, Sustainable Tourism, and Regional Tourism to Boost Inbound Tourism and Further Develop the Tourism Industry
-
(1)
Government initiatives to boost inbound tourism
-
(2)
Sustainable tourism and attracting tourists to regional areas
-
(3)
Value-added businesses for tourist destinations and tourism industry through tourism digital transformation and ICT

-
Tourism and Hospitality Report

You can download the whole report on the webpage free of charge. Please simply fill out the form below to get information on promising industries in the Japanese market. Download now and use the information for your success in business.
-
- Business Expanding
- Tourism & Hospitality
- Saitama city
- Indonesia
Unicorn Online Travel Agency Startup, PT Global Tiket Network Establishes an Office in Saitama
-
- Business Expanding
- Tourism & Hospitality
- Thailand
THE EXECUTIVE LOUNGE (THAILAND), which operates executive lounges at international airports in Thailand, has opened its second lounge inside Chubu Centrair International Airport
-
- Business Expanding
- Tourism & Hospitality
- India
RN Tours & Travels Pvt Ltd, an Indian company providing travel services within India and abroad, has established an office in Gifu
Contact Us
Investing in and collaborating with Japan
We will do our very best to support your business expansion into and within Japan as well as business collaboration with Japanese companies. Please feel free to contact us via the form below for any inquiries.
Inquiry FormJETRO Worldwide
Our network covers over 50 countries worldwide. You can contact us at one of our local offices near you for consultation.
Worldwide Offices