


News & Updates
Results of JETRO's 2019 Survey on Business Conditions of Japanese Companies in Europe
Jan 28, 2020
65% of Japanese-Affiliated Companies in the EU Have Utilised the EU-Japan EPA.
Companies Seek to Expand Their Market in the EU by Strengthening Their Company Brands.
Between September and October 2019, the Japan External Trade Organization (JETRO) conducted its latest survey on the business conditions of Japanese-affiliated companies in Europe. 842 valid responses were received (86.0% response rate) out of 979 to whom we sent questionnaires.
Survey Items :
- Operating Profit Forecast
- Current Domestic Market and Future Prospects
- Operational Challenges
- Britain's Exit from the European Union
- Impact of Changes in Trade Environment
- EPA/FTA
- Local Procurement and Future Direction
- Sales Destinations and Future Policy
- Future Promising Sales Destinations
- Business Outlook For Next 1 or 2 Years
- Changes in Number of Employees
- High Value-Added & Differentiation Initiatives
Key findings
- The percentage of Japanese-affiliated companies in Europe predicting that they would be profitable was 70.5%. The rate has been above 70% for five consecutive years.
- The most common operational challenge cited was “UK’s exit from the EU.” An “economic slump in the UK” and “logistical dysfunction, customs clearance procedures” were the most common concerns shared by Japanese companies in Europe in relation to the UK’s exit from the EU
- Among EU-based companies engaged in import activities from Japan to the EU, 65.5% responded that they have already utilised the Japan-EU Economic Partnership Agreement (EPA). All of the respondents from the transport activities/warehouse industry, the plastic products industry, and the rubber products industry responded that they have used the Japan-EU EPA for import from Japan to the EU. (Page 38)
Survey Results Summary
According to the survey conducted by JETRO between September and October 2019, despite downside risks of the business climate caused by the US-China trade friction, uncertainty regarding progress in the UK’s departure from the European Union and other external factors, the greater portion of Japanese-affiliated companies in Europe have been successful in securing a profit. The survey shows that companies aggressively utilisze the Japan-EU EPA’s preferential tariffs. On the other hand, the survey indicates that companies, especially in the manufacturing sector, are concerned that increased costs, due to burdens such as Brexit preparation and a sharp rise in labour cost, would put pressure on their profits the coming year.
1. Operating Profit Forecast
Looking at operating profit forecast trends over the last 8 years, this year the percentage of Japanese-affiliated companies in Europe predicting that they would be profitable was 70.5%. The rate has been above 70% for five consecutive years (Figure 1, 2 and Page 7 and 9). Due to favourable employment conditions, rising wages and private consumption, demand in the region has been firm, reflecting continued subdued but steady economic growth.
Figure 1. Operating Profit Forecast Trends for Europe and UK
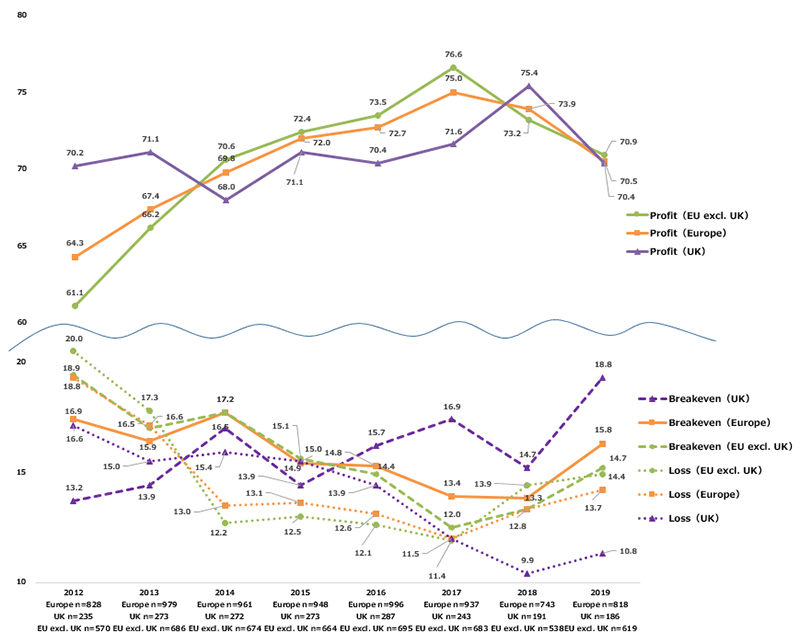
Source: JETRO’s 2019 Survey on Business Conditions of Japanese Companies in Europe
- When comparing the 2019 operating profit forecast to the 2018 operating profit results, the percentage of companies in Europe predicting an “Increase” and the percentage of those expecting a “Decrease” were almost the same (30.1% and 30.5%, respectively). In the manufacturing sector, the percentage of companies expecting a “Decrease” was 36.7%, more than 10 percentage points higher than the percentage of companies predicting an “Increase” (26.6%). The most common reason for a “Decrease” in sales forecast of the manufacturing sector was “Sales decrease in local markets” (71.9%) in Western Europe and “Increase of labour costs” in Central and Eastern Europe (82.6%). (Page 10)
- For the 2020 compared to 2019 operating profit forecast, the proportion of Japanese-affiliated companies from the manufacturing sector who responded “Decrease” was prominent in the UK and Central and Eastern Europe, standing at 24.6% and 21.9%, respectively. The reason for the “Decrease” common in both areas was due to “Sales decrease in local markets” (68.8% and 35.7%, respectively). Many of these companies in the UK also cited “Increase of procurement costs” (43.8%) and negative “Effects of Brexit” (37.5%), while in Central and Eastern Europe “Increase of labour costs” (50.0%) was also another common response. On the other hand, the proportion of companies who replied “Increase” was relatively high in the non-manufacturing sector in Central and Eastern Europe, standing at 48.6%. The most common reason these companies cited was “Sales increase in local markets” (88.2%), followed by “Improvement of sales efficiency” (41.2%). (Page 11)
- Regarding the companies’ views on current market conditions in the country that they are based in, the total response rate for all companies in Europe who replied “Better” (8.7%) and “Slightly better” (23.9%) was 32.6%, a significant drop of 24.5 percentage points from the previous year (57.1%). The slowdown was particularly noticeable in the manufacturing sector in Western Europe, where the same rate was 24.2%, a 33.5 percentage point decrease since last year (57.7%). The total response rate for companies in Central and Eastern Europe who replied “Better” (25.2%) and “Slightly better” (38.3%) was 63.5%, a higher rate than Western Europe (27.9%). (Page 15)
Figure2. 2019 Operating Profit Forecast
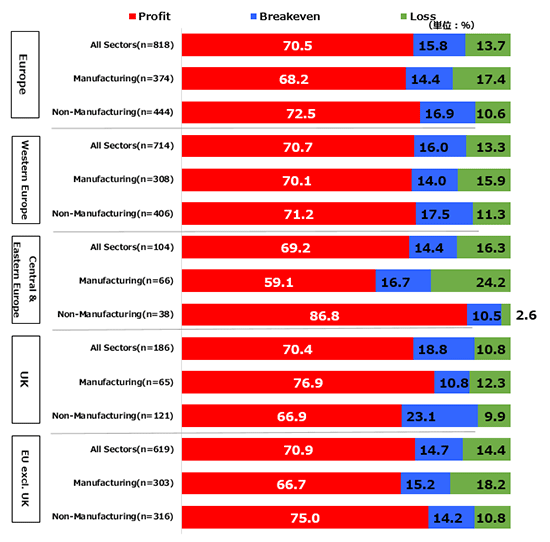
Source: JETRO’s 2019 Survey on Business Conditions of Japanese Companies in Europe
2. Britain's Exit from the European Union
The most common operational challenge sited was “UK’s exit from the EU” (56.5%). Uncertainties from the multiple extensions of the exit date resulted in making Brexit the biggest operational challenge for companies. (Figure 3 and Page 17)
“Economic slump in the UK” continued to be the most common concern of Japanese-affiliated UK based companies in relation to Brexit since 2017. This was followed by “Pound continues weakening” and “Changes in UK Regulations and Legislation”. (Page 29)
Regarding “Trade”, companies were asked to expand on why this is a concern; for both UK based companies and companies based in the EU other than the UK the largest response was “Logistical dysfunction, customs clearance procedures” (91.8% and 86.8% respectively), followed by “Tariffs” (67.2% and 64.8% respectively). (Figure 4 and Page 30)
| 2019(n=803) (Units:%、point) |
Change since 2018 | ||
|---|---|---|---|
| 1 | UK's Exit from the EU | 56.5 | — |
| 2 | Securing Human Resources | 41.8 | △ 1.8 |
| 3 | High Labour Costs | 40.3 | △ 0.2 |
| 4 | Lower Prices offerd by Competitors | 33.0 | 3.6 |
| 5 | EU General Data Protection Regulation(GDPR) | 32.5 | 2.5 |
Source: JETRO’s 2019 Survey on Business Conditions of Japanese Companies in Europe
Figure4. Concerns Related to "Trade"
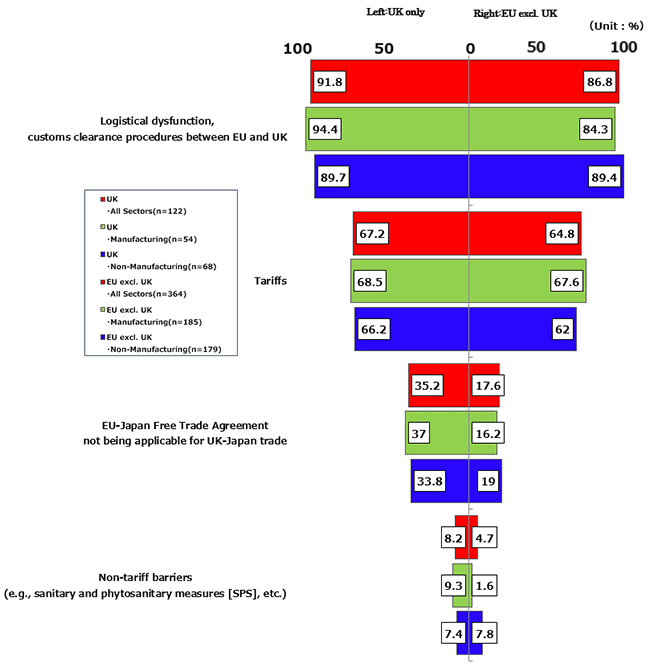
Source: JETRO’s 2019 Survey on Business Conditions of Japanese Companies in Europe
- Examining companies citing “UK’s exit from the EU” as an operational challenge by country and sector, the highest response rate came from the UK (87.1%) for the manufacturing sector and Ireland (73.3%) for the non-manufacturing sector, followed by the UK (70.3%). For Germany, the rates were high in both manufacturing and non-manufacturing sectors (54.3% and 59.3% respectively). When asked about major specific concerns related to “UK’s exit from the EU”, UK based companies and EU based companies both cited “Short-term impact of a disorderly exit” as the biggest challenge (92.7% and 81.8% respectively). (Page 21)
- For Japanese-affiliated companies in the EU other than the UK, “Export from the EU (other than the UK) to the UK” was the most common response, followed by “Economic slump in the UK” and “Economic slump in the EU”. (Page 29)
- When companies citing “Changes in UK Regulations and Legislation” were asked to expand on why this is a concern, for both UK based companies and EU based companies the largest response was “Constraints of free movement of persons between the EU and UK” (51.8% and 43.4% respectively). This response was especially high in the non-manufacturing sector (58.3% and 50.0% respectively). (Page 30)
- In terms of preparation for the UK’s exit from the EU so far, the highest response rate for the “Already prepared” and “Preparing” categories for UK companies was towards “Complying with changes to regulation or legislation” (6.7% and 15.4% respectively). Specifically, these companies cited “REACH” and “Establishment of offices in new locations”. For EU based companies, the highest response rate for “Already prepared” was regarding “Obtaining Financial Passporting Authorisation in another EEA country” (8.4%). (Page 31)
3. Utilisation of the Japan-EU EPA
When Japanese-affiliated companies based in the EU were asked about the utilisation of the Japan-EU EPA, 65.5% have already utilised it for import from Japan to the EU and 53.1% for export from the EU to Japan. By country, the utilisation rates were over 80% for both import and export for Italy, while the rates were also over 70% for Spain. (Figure 5 and Page 37, 39)
Examining by industry, all of the respondents from the transport activities/warehouse industry, the plastic products industry, and the rubber products industry responded that they have used the Japan-EU EPA for import from Japan to the EU. (Page 38)
In terms of items that may be problematic when using the Japan-EU EPA, within EU based companies, the top issue was “Proof of origin procedures (self-certification)” at 47.3%, increasing by more than 10 percentage points from the previous 34.6%. In addition, “Cooperation with supplier/business partners” (44.0%) and “In-house system improvements” (39.0%) also continued to be major challenges as with the previous survey. (Page 41)
| Status of Utilisation of Japan-EU EPA | Responses | % |
|---|---|---|
| Companies engaging in import from Japan to the EU | 359 | 100.0% |
| Currently utilising | 235 | 65.5% |
 Considering to utilise Considering to utilise |
92 | 25.6% |
| Not (planning) to Uutilise |
32 | 8.9% |
| Companies engaging in export from the EU to Japan | 162 | 100.0% |
| Currently utilising | 86 | 53.1% |
| Considering to utilise |
49 | 30.2% |
| Not (planning) to Utilise |
27 | 16.7% |
Source: JETRO’s 2019 Survey on Business Conditions of Japanese Companies in Europe
- As for imports from Japan to the EU, the highest utilisation rate came from Japanese affiliated companies based in Italy at 85.7%, followed by Czechia at 77.3%, Spain at 75.0%, Poland at 72.7%, Belgium at 70.0%, the Netherlands at 66.7%, Germany at 66.1%, and the UK at 61.8%. (Page 37)
- Examining by industry, the utilisation rate of the Japan-EU EPA for import was high in industries such as fabricated metal products (80.0%), textiles (80.0%), transportation equipment parts (79.5%), sales company (72.1%), and food/processed food, agricultural or fishery products (70.0%). For exports from the EU to Japan, higher utilisation rates came from sectors such as transport activities/warehouse (88.9%), transportation equipment parts (76.5%), and sales company (72.7%). (Page 38)
- Regarding the local procurement of parts and raw materials for EU based companies, the simple average of companies’ responses (value-based) was calculated. The average procurement rate from Japan increased 1.2 percentage points to 32.6%. A particularly high rate of 46.6% came from Germany in which a cluster of Japanese-affiliated companies is formed. The procurement rate from Japan was also high in Belgium and the Netherlands, which have been logistical hubs for Europe. The utilisation ratio of the Japan-EU EPA was high among Japanese-affiliated companies based in these countries who have enjoyed the benefits of reduced tariffs (page 37, 45).
- 23.2% of EU based companies responded that they would “Increase” procurement from Japan. This trend was more prominent in the non-manufacturing sector; notably, nearly half of the wholesale and retail trade (including trading) sector (47.8%) chose this response. (Page 49)
4. Other Major Trends Found Based on the Survey Results
- Securing Human Resources Continues to be an Operational Challenge.
- “Securing human resources” is the second biggest operational challenge for companies, although since last year the rate has fallen by 1.8 percentage points to 41.8% (page 17). The response rate for “Securing human resources” was particularly high in Central and Eastern Europe. The highest rate came from Czechia at 79.3%, despite a 11.2 percentage point decrease, where according to Eurostat the unemployment rate was 2.1% as of September 2019, followed by Hungary (72.2%) and Poland (57.7%), with unemployment rates of 3.4% and 3.3% respectively (page 19, 23).
- Looking at the breakdown of “Securing human resources”, “Management personnel” was cited as most difficult to secure at 59.2%, followed by “Factory workers” at 28.6% and “IoT/AI specialists” at 21.1%. The most common response was “Management personnel” (60.9%) in Western Europe and “Factory workers” (62.9%) in Central and Eastern Europe. (Page 23)
- EU Based Companies Intend to Strengthen Their Sales Functions, Viewing the EU as a Whole as Their Potent Market.
Regarding the sales destinations for EU based companies, the simple average of companies’ responses (value-based) was calculated. The EU accounts for nearly 80% of their sales destinations on average, indicating that the main objective of Japanese-affiliated companies in setting up a business in the EU is to access the EU market (page 50). Poland, which was ranked as the second most “promising sales destination” after Germany in the previous survey, moved up to the first place this year (page 52). For the next 1-2 year business outlook across all sectors in Europe, 50.8% said “Expansion”, an increase of 1.3 percentage points from the previous survey (49.5%) (Page 54). When they were asked which functions were intended to be expanded, the most common answer was “Sales functions” (300 companies) (page 57).
- Europe Based Companies Seek to Strengthen Their Company Brands
When Europe based companies were asked what initiatives were being undertaken to differentiate or add high value to their products and services being sold: the most common response was “Strengthening company brand” at 48.9%, followed by “Strengthening technical skill training resources and increasing the number of skilled engineers” at 32.0%, and “Strengthening R&D functions” at 28.3%. Reasons for selecting “Strengthening company brand” included “Because it is necessary for communicating the importance of authentic products.” Reasons for selecting “Strengthening technical skill training resources and increasing the number of skilled engineers” included “to develop new products” and “to strengthen company’s capability to provide services”. (Page 62)
Part of the survey results were issued on October 2019 as a flash report titled“Impact of UK’s Exit from European Union on Japanese Companies in Europe.”
Survey Reports
-
TANAKA Susumu, FUKUI Takayasu, YAMADA Yoshiyuki
Europe, Russia and CIS Division, JETRO
Tel: 03-3582-5569
E-mail: ORD@jetro.go.jp