


News & Updates
FY2022 JETRO Survey on Business Conditions for Japanese Companies Operating Overseas (North America)
Feb 24, 2023
Key Points Regarding the Survey Results
With the economy recovery, profitability of Japanese companies operating in North America are expected to improve. Although higher costs due to high inflation pushed down on business sentiment.
The attached document: FY2022 JETRO Survey on Business Conditions for Japanese Companies Operating Overseas (North America)![]() (1.6MB)
(1.6MB)
This is the English version of the press release issued on December 20, 2022.
- The percentage of Japanese companies expecting to be profitable for 2022 was in the mid-60% range in the U.S. (64.3%) and over 70% in Canada (71.0%), both up from the previous year (59.2% in the U.S. and 67.5% in Canada), but falling short of 2019 levels (66.1% and 77.1%) before the COVID-19 pandemic. The diffusion index (DI) for business sentiment was 18.4 in Canada, up slightly from the previous year (15.8), but down significantly from the previous year (34.7) to 17.5 in the U.S. While companies have captured the increase in demand during the recovery from the COVID-19 pandemic, the sharp rise in raw material and parts procurement costs due to rapid inflation has put downward pressure on business sentiment.
- In both countries, the top management issue was "increase in wages of employees" (67.5% and 61.8%, respectively), followed by "rising logistics costs" (56.9%) in the U.S. and "difficulty in recruiting workforce (general staff)" (47.3%) in Canada.
- More than 50% of companies in both countries plan to review their supply chains in the future, due to soaring raw material and logistics costs or to address the risk of supply disruptions (54.9% in the U.S. and 50.4% in Canada). The most common reasons for reviewing their supply chains were “increase in sales prices" and "review of procurement source," with a noticeable shift in procurement sources from Japan and China to the U.S. and Mexico, particularly in the manufacturing sector.
- Nearly 30% (26.6%) of companies in the U.S. and just under 20% (19.1%) in Canada indicated that changes in the trade environment would have a "negative impact" on their business performance. The most common specific policy that would have a "negative impact" in both countries was "additional tariffs imposed on Chinese products based on Section 301 of the U.S. Trade Act of 1974”.
- Meanwhile, nearly 50% (48.7%) of companies in the U.S. and more than 40% (43.1%) in Canada will expand their business in the next 1-2 years, which is higher in both countries than in it was 2019 (47.5% in the U.S. and 35.6% in Canada) before the COVID-19 pandemic. The leading reason for the expansion is “high growth potential” in both countries, and companies in both countries are strengthening their “sales functions” with the aim of expanding their sales channels in the North American market.
Overview of FY 2022 Survey
- In September 2022, JETRO has conducted an online survey on the state of Japanese companies operating in the U.S. and Canada (those that are at least 10% owned by a Japanese parent, directly or indirectly, and branches of Japanese firms in the U.S.). 925 responses (787 in the U.S., 138 in Canada) received from 2,025 survey sent (1,841 in the U.S., 184 in Canada, response rate 45.7%).
- This survey is conducted once a year to ascertain the management situation and changes in the local business environment of Japanese companies operating in the U.S. and Canada. This is the 41st annual survey for the U.S. and the 33rd for Canada. Branch offices of Japanese companies were added to the scope of survey this time.
- Topics:
- Operating Profits Forecasts
- Future Business Direction
- Employment and Wages
- Supply Chains
- Supply Chains and Human Rights
- Responding to Environmental Issues
- Impact of Changes in Trade Environment
- Management Challenges and Responses
- Biden Administration Policies
- Relations with Local Communities
Points of Survey Results
1. Operating Profits Forecasts: Profitability is approaching pre-COVID-19 pandemic levels, but prospects are uncertain
- With demand on the rise due to the economic recovery, the percentage of Japanese companies that expected to be profitable for 2022 was 64.3% in the United States, up 5.1 points from the previous year (59.2%). In Canada, it was 71.0%, up 3.5 points from the previous year (67.5%). However, the results did not quite reach the levels seen in 2019 (66.1% in the U.S. and 77.1% in Canada) before the COVID-19 pandemic.
- In the U.S., 71.5% of companies in the non-manufacturing sector expected to be profitable, but only 58.6% in the manufacturing sector did. By industry, this sentiment was strong among companies in general machinery (81.7%) and electrical machinery/electronic devices (75.9%) in the manufacturing sector, but only 17.1% of those in automotive etc. parts, which were affected by a decrease in the number of automobiles manufactured due to a shortage of semiconductors, gave this answer. For the non-manufacturing sector, the response from companies in transport (95.7%) was strong due to the surge in freight rates caused by the supply chain turmoil, while sentiment was low among companies in travel/amusement—where the recovery in travel demand is lagging—at only 37.5%. In Canada, the percentage of companies expecting to be profitable exceeded 70% in both the manufacturing (70.2%) and non-manufacturing sectors (71.6%). By industry, food and automobiles accounted for 83.3% in the manufacturing sector, while in the non-manufacturing sector, sales companies/sales subsidiaries accounted for 84.2%.
Figure 1. Trends in Profit Forecasts and Business Sentiment (DI) Among Japanese Companies Operating in the U.S. and Canada (2007-2023)
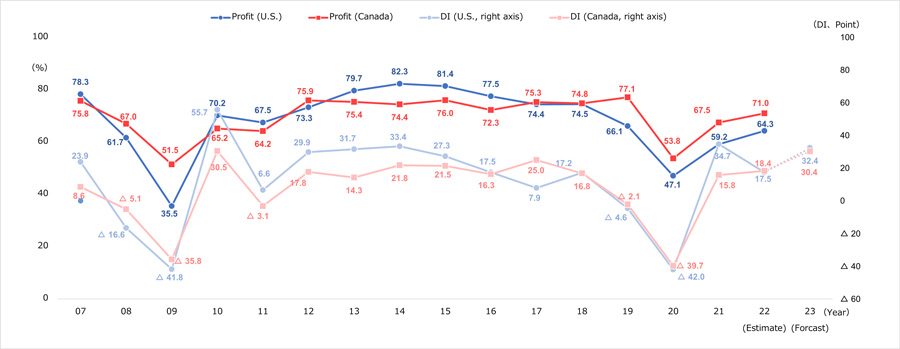
- The DI index (Note 1) indicating business sentiment was 17.5 in the U.S., a significant decline from the previous year (34.7). The DI was 18.4 in Canada, up 2.6 points from the previous year (15.8).
- The percentage of companies expecting an “increase” in operating profit for 2022 was 41.9% in the U.S., down 9.7 points from the previous year, while 24.4% of companies expected a “decrease", up 7.5 points from the previous year. In Canada, 37.5% of companies predicted an “increase", down 1.9 points from the previous year, and a “decrease" was expected by 19.1%, down 4.5 points from the previous year. The main reason for the improvement in the operating profit forecast was “reactionary increase due to the reduced impact of COVID-19” (20.1% in the U.S. and 28.0% in Canada). Meanwhile, the main reason for the expected decrease was “rising raw material procurement/parts procurement costs” (25.3% in the U.S. and 19.2% in Canada).
2. Future business development: Continue business expansion as a growth market
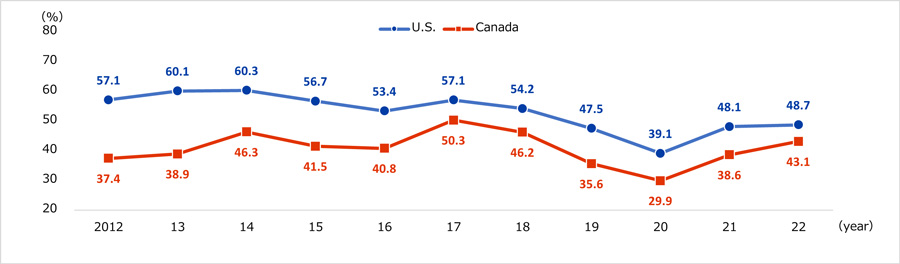
- The percentage of companies that will “expand” their business in the next 1-2 years was 48.7% in the U.S. and 43.1% in Canada. Respondents in both countries have continued to show an upward trend in their appetite for business expansion, surpassing the figure in 2019 (47.5% in the U.S. and 35.6% in Canada) before the COVID-19 pandemic. By industry, companies in precision and medical equipment (82.4%) and in Mining/energy (80.0%) accounted for more than 80% of the total in the United States, while in Canada, over 80% of companies in Food (83.3%) gave this response.
- The main reason for expansion was "high growth potential" and "high potential" in both countries. In terms of expanding functions, "sales function" was the most prominent response in both countries, followed by "production (high value-added products)" and "production (general-purpose products)."
Figure 2. Proportion of Companies Considering Business “Expansion” in the Next 1-2 Years
- In terms of capital investment in 2022, the percentage of companies that will increase their capital investment in monetary terms over the previous year exceeded 30% in both countries (30.7% in the U.S. and 31.9% in Canada), marking the second consecutive year that the percentage of companies that will increase has risen. The top purposes of capital investment were "maintenance and repair of existing facilities," "increase production and sales capacity," and “adaptation of digitalization.”
- Less than fifty percent (49.2% in the United States and 48.1% in Canada) of companies reviewed their supply chain (sales, procurement and manufacture) in the period from the outbreak of COVID-19 to the time of the survey (September 2022). More than fifty percent (54.9% and 50.4%, respectively) of companies have plans for such reviews in the future. It was in precision and medical equipment (82.4% up to the time of the survey and 76.5% going forward) in the U.S., and in Automobiles etc. (100% and 83.3%) in Canada, in which the largest proportions of companies had made these reviews or planned to do so.
- In terms of the nature of future sales reviews, in both countries, “increase in sales prices" and “change of sales destination" were ranked high. "Soaring logistics costs" was the most common reason for future sales review. Regarding the countries/regions where future sales destinations will be changed, changes within the domestic market (38 out of 88 in the U.S. and 11 out of 20 in Canada) accounted for the majority.
- In both countries, “review of procurement” was the most common reason for procurement reviews going forward. The main reasons for reviewing procurement in the future were “soaring logistics costs,“ ”response to future supply chain disruption risk caused by logistics disruption,” and “soaring raw materials costs”. In terms of countries/regions to serve as procurement sources going forward, there were many domestic changes (29 cases) within the United States. Changes (28) from Japan to the United States, from China to the United States (15), and from China to Mexico (7) were also cited by many U.S.-based companies, showing signs of a shift in suppliers from Japan and China to the United States and Mexico, mainly in the manufacturing sector. In Canada, the United States was the most frequently selected source of procurement after review (6 cases).
- In terms of the nature of future production reviews, “increase in new investment/capital investment,” “promotion of automation/labor conservation,” and “review of production site” were ranked high in both countries. Reasons for future production reviews were “soaring labor costs," "optimization of production cost," and “soaring raw material costs" in both countries. As for the countries/regions to serve as production sites going forward, the change from the U.S. to Mexico (11 cases) was the most favored. There were eight cases of change within the U.S.
- As for future reviews of control/management systems, “strengthening human resource development” was the most cited in both countries, followed by "reviewing the use of telecommuting and teleworking."
3. Employment and Wages: Wage increase pressures emerges due to tight labor market
- Looking at changes in the number of local employees and the number of expatriates from Japan, we see that “decrease” exceeded “increase” in both the U.S. and Canada compared to before the COVID-19 pandemic. Regarding plans going forward, nearly 50% (47.5%) of companies in the U.S. and nearly 40% (36.3%) in Canada plan to "increase" the number of local employees.
- The median (nominal) rate of base pay increase for FY2022 was 4.0% in the U.S. and 3.0% in Canada. The median rate increase for FY2023 is expected to be 3.5% in the U.S. and 3.0% in Canada.
- Regarding employee work arrangements with a job amenable to remote working, as of September 2022 (the time of the survey), just under 40% (39.0%) of companies in the U.S. and about 30% (30.5%) of companies in Canada had their employees come to work in-office full-time in principle. The percentage of companies planning to have their employees come to work in-office full-time in principle from January 2023 onward was around 40% (40.9%) in the U.S. and slightly over 31.2% in Canada.
4. Supply Chain: Procurement/sales policy trending toward “local production/consumption”
- Regarding procurement sources of companies in the U.S. for raw materials/parts, just under 50% (49.5%) of companies in the manufacturing sector procured from within the U.S., and more than 40% (43.0%) of non-manufacturing sector companies procured from Japan. As for procurement policies going forward by country, many were expecting to increase procurement from within the U.S. (83 companies for the manufacturing sector and 48 companies for the non-manufacturing sector). Meanwhile, more companies expected to decrease procurement from China (30 companies for the manufacturing sector and 16 companies for the non-manufacturing sector) than to increase it (7 companies for both manufacturing and non-manufacturing sectors). In Canada, the percentage of companies that procure within Canada were in the mid-30% range (34.5%). As for procurement policies going forward by country, many were expecting to increase procurement from within Canada and the U.S. (8 companies for both countries).
- Regarding production sites for products for the U.S. market, the percentage of companies producing products within the U.S. was in the mid-60% range (64.5%). By industry, 83.4% of companies in automotive etc. parts produced products within the U.S. As for production structure going forward by country, many were expecting to increase production within the U.S. (55 companies) and Mexico (20 companies). Meanwhile, the number of companies expecting to decrease production in Japan and China (27 companies for Japan, and 12 companies for China) exceeded those that expected to increase production there (24 companies for Japan and 5 companies for China).
- Regarding the sales markets of companies in the U.S., the U.S. market accounted for nearly 80% of respondents (77.8% of the manufacturing sector and 77.3% of the non-manufacturing sector). In Canada, the percentage of companies conducting sales within Canada was in the mid-60% range (65.9%).
5. Supply Chains and Human Rights: Human rights in business activities is in its infancy
- The percentage of companies recognizing human rights issues in the supply chain as a management challenge was in the mid-50% range (54.5%) in the U.S., and just under 60% (59.2%) in Canada. There was a significant disparity in recognition by company scale, with over 60% of large companies recognizing these issues (64.9% in the U.S. and 67.5% in Canada), but less than 50% of small and medium-sized companies (48.4% in the U.S. and 47.2% in Canada).
- The percentage of companies that conducted Human Rights Due Diligence (HRDD) in their business activities was around 40% (40.3%) in Canada, but slightly over a quarter (25.1%) in the U.S.
6. Responding to Environmental Issues: Increasingly more companies are taking action
- The percentage of companies recognizing decarbonization in the supply chain as a management challenge was nearly 70% (68.3%) in the U.S., and more than 70% (73.0%) in Canada. Just under 40% (39.1%) of companies in the U.S. and more than 60% (62.7%) of companies in Canada are already making decarbonization efforts. The percentage of companies engaged in decarbonization increased from the previous year (33.5% in the U.S. and 43.2% in Canada).
- The most common effort (including those being considered) by companies that are already making efforts or are planning to make efforts both in the U.S. (67.3%) and Canada (64.2%) was “conservation of energy/resources.”
- Of the companies that responded, nearly 40% (37.4%) in the U.S. and just under 70% (69.8%) in Canada make or are planning to make efforts on Scope 1 or Scope 2 (Note 2), while just under 30% (29.4%) in the U.S. and over 50% (52.4%) in Canada make or are planning to make efforts on Scope 3.
7. Impact of Changes in the Trade Environment: U.S.-China conflicts as the largest factor of "negative impact"
- Regarding the impact of changes in the trade environment on business performance, the largest percentage of respondents in the United States answered "No impact" (34.5%), followed by "Negative impact" (26.6%) and "Don't know" (23.1%). In part because more than a year and a half has passed since the Biden administration was inaugurated in January 2021, the percentage of respondents who answered “Don't know" decreased by 5.9 points from the previous year (29.0%). Meanwhile, the "same level of negative and positive impacts" increased by 2.7 points.
- Canada also saw the highest percentage of responses of "No impact" (44.3%), followed by "Don’t know" (25.2%) and "Negative impact" (19.1%). "Not known" decreased by 6.2 points from the previous year (31.4%), while "No impact" increased by 3.6 points and "Negative impact" increased by 2.2 points.
- Specific policies having a “negative impact” were “additional tariffs based on Section 301 of the Trade Act” (US: 52.4%, Canada: 40.9%) for both countries. In the United States, “retaliatory tariffs on the United States of China” (34.0%) and “additional tariff assessments on U.S. steel and aluminum” (20.4%) were the next highest responses. In Canada, “additional tariff assessments for U.S. steel and aluminum” (31.8%), “strengthening of export/import control and investment regulations by the Canadian government,” and “economic sanctions against Russia” (both 13.6%) were the next most cited responses.
8. Management issues: "Increase in employees' wages" is the top issue due to inflation
- While there are signs of recovery from the COVID-19 pandemic, rapid inflation has had an impact on management, with the top management challenge in both countries being "wage increases for employees" (67.5% in the U.S. and 61.8% in Canada). In the United States, "increase in logistics costs" (56.9%) and "development of new customers" (52.5%) were the next most highly cited, while in Canada, it was "securing employees (general employees)" (47.3%), "increase in logistics costs" (46.6%), and "increase in procurement costs" (45.8%), with many companies citing problems in terms of employment, labor, and the procurement of raw materials and parts.
- In terms of measures to address management issues, the highest proportion of companies in both countries cited “wage increases” (59.3% in the U.S. and 55.5% in Canada). In the United States, “review of suppliers and content of procurement” (40.5%) and “differentiation from competing products” (36.7%) followed, while in Canada, “cost reductions other than personnel expenses” (41.8%) and “differentiation from competing products” (39.1%) were the next most highly cited.
- Regarding the trend of the yen's depreciation against the U.S. dollar (Canadian dollar) since the beginning of 2022, more than 30% (32.1%) of firms in the U.S. cited an overall positive impact, followed by "no impact" (26.2%), and "similar positive impact with a negative impact" (18.5%). Among Canadian companies, "no impact" accounted for one-third (33.3%), followed by "overall positive impact" (23.3%) and "negative and positive impact to the same extent" (17.8%).
- A specific positive impact was a decrease in the cost of imports from Japan, while a negative impact was an increase in the amount of investment in new investments. There were also some companies whose transactions in yen were limited and who therefore had no impact.
9. Impact of the Biden administration's policies (US only): "Don’t know" decreased
- Regarding the impact of the Biden Administration's policies on business activities, "don't know" accounted for more than 30% (32.9%), followed by "no impact" (26.1%), "similar impact to negative effect" (14.9%), and "negative impact" (13.8%). "Don't know" decreased by 5.5 points from the previous year (38.4%), and "Positive impact" decreased by 2.4 points from the previous year (13.6%), while "No effect" increased by 3.8 points from the previous year (22.3%).
- By industry, companies in plastic products (28.0%) and trading and wholesaling (22.5%) reported negative impacts, while those in rubber, ceramics, stone and clay (44.4%) and construction (27.3%) reported positive impacts.
- In terms of policy areas affecting business, more than 40% (43.3%) of companies cited the U.S. corporate taxation system, followed by policies toward China (34.7%), economic policy (including anti-inflation measures) (31.6%), port cargo congestion measures (29.0%), and climate change measures (25.4%).
10. Relationship with local communities, such as state governments (U.S. only): Relationship building cited by majority of respondents
- With regard to building relationships with local communities such as state governments, a total of nearly 60% (56.1%) of companies have dialogue channels, including “building good relationships” (26.1%) and “building relationships to the extent that dialogue can be conducted”. By industry, this response was given by nearly 70% of companies in manufacturing (67.1%) of the total, while accounting for slightly over 40% of companies in non-manufacturing (42.4%).
- In terms of points of contact with local communities, participation in local commerce and industry associations was a conspicuous response, and some responded that they were contributing in terms of job creation. Companies that had good relationships with local communities expressed the opinion that they "received a great deal of support from the local government when they relocated" and "received assistance in cooperation with the state and city regarding land acquisition and environmental measures." On the other hand, companies that did not have such relationships said that they "do not know what to start with" or "are small in size and do not appear to be cost-effective."
- (Note 1)
- Short for Diffusion Index, this is the figure equal to the percentage of companies with an increased operating profit minus the percentage of companies with a decreased operating profit.
- (Note 2) Scope1:
- Direct greenhouse gas (GHG) emissions by the activities of the business (fuels combustion, industrial processes)
- Scope2:
- Indirect GHG emissions from the use of electricity, heat, and steam supplied by other companies
- Scope3:
- Indirect GHG emissions other than Scope 1, Scope 2 (GHG emissions by other companies related to the the activities of the business)
-
Japan External Trade Organization (JETRO)
Americas Division, Overseas Department (Representatives: Takashi Nakamizo, Hirohisa Akahira, Taisuke Kassai, and Shinichiro Takimoto)
Tel: +81-3-3582-5545