


News & Updates
FY2021 JETRO Survey on Business Conditions for Japanese Companies Operating Overseas (North America)
Mar 25, 2022
Key Points Regarding the Survey Results
With the reopening of the economy, earnings of Japanese companies operating in North America are expected to improve.
Companies that have their sights set on business expansion in the next one to two years have surpassed the 2019 level.
The attached document: FY2021 JETRO Survey on Business Conditions for Japanese Companies Operating Overseas (North America)![]() (2.0MB)
(2.0MB)
This is the English version of the press release issued on December 17, 2021.
- With the reopening of the economy after the economic slowdown caused by the spread of Covid-19, a little less than 60% and close to 70% of Japanese companies operating in the U.S. and Canada, respectively, expect to be profitable in 2021, which is a 10-point increase from the preceding year for both countries; however, recovery is still not to the 2019 level. Compared to 2010, immediately after the financial crisis, the pace of recovery in the U.S. is slow, but Canada’s recovery exceeded that of 2010.
- Close to 50% of companies in the U.S. and close to 40% of companies in Canada have set their sights on business expansion in the next one to two years, exceeding 2019 levels. The leading factor given for expansion was “sales increase in local markets.”
- The issue of human rights in supply chains is recognized as a management issue in close to 60% and close to 70% of Japanese companies operating in the U.S. and Canada, respectively. Roughly half and a little over 60% of Japanese companies operating in the U.S. and Canada, respectively, have policies related to respecting human rights in supply chains, and a little over 40% of such companies in the U.S. and Canada are seeking compliance with such policies by their procurement sources.
- Regarding the impact on earnings from changes in the trade environment, the companies in the U.S. responded “Have no impact,” “Do not know” and “Have a negative impact overall,“ each of which accounted for about 30 % of the responses. Compared to last year, the companies that responded “Do not know” increased by 10% or more.
- When asked about management challenges, the leading issue cited by the respondents was “Slow development of new customers” for both U.S. and Canada. As countermeasures for management challenges, “Differentiation from competing products” was the highest response in both countries.
- A little over 30% of the companies in the U.S. and a little over 40% of the companies responded that they were engaging in decarbonization. By industry, in the U.S., more than 50% of companies in the automobiles etc., the rubber/ceramic/stone and clay products, and electrical machinery/electronic devices industries responded that they were engaging in decarbonization.
- Regarding the impact of the Biden administration’s policies on business activities, close to 40% of the respondents said “Do not know,” a little over 20% said “Have no impact,” and 10% said “Have a negative impact overall” and “Have a positive impact overall.” When asked about which areas in the Biden administration’s policies will have an impact on business, the top responses were “corporate tax plan,” “countermeasures for Covid-19,” “policies against China,” and “environmental and energy policies (climate crisis measures).”
Overview of FY 2021 Survey
- In September 2021, JETRO has conducted an online survey on the state of Japanese companies operating in the U.S. and Canada (that are at least 10% owned by a Japanese parent, directly or indirectly, and branches of Japanese firms in the U.S.). 978 responses (851 in the U.S., 127 in Canada) received from 1,878 survey sent (1,697 in the U.S., 181 in Canada, response rate 52.1%).
- This survey is conducted once a year to ascertain the management situations and changes in the local business environments of Japanese companies operating in the U.S. and Canada. This is the 40th annual survey for the U.S. and the 32nd for Canada. Branches of Japanese companies were added to the scope of survey this time.
- Topics:
- Operating profits forecasts,
- Future business direction,
- Policy on human rights with respect to matters such as occupational safety and health in supply chains,
- Addressing environmental issues,
- Utilization of digital-related technologies and associated challenges,
- Challenges in management,
- Biden administration’s policies,
- Impact of changes in trade environment,
- Procurement sources, manufacturing ratios, and sales destinations by countries or regions,
- Utilization and impact of FTAs/EPAs
Points of Survey Results
1. Operating Profit Forecasts
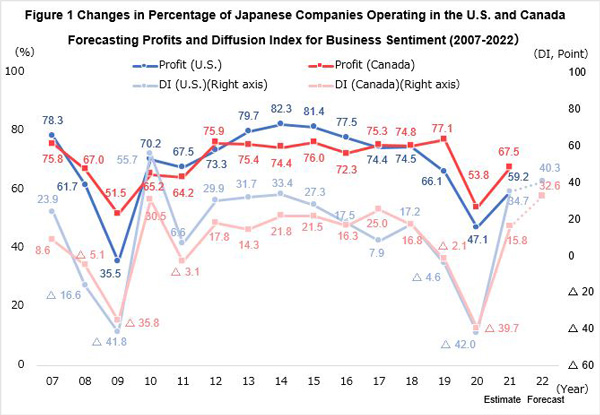
- 59.2% of Japanese companies operating in the U.S. expect to be profitable in 2021, a 12.1 points increase from the preceding year (47.1%). In Canada, at 67.5%, it was a 13.7 points increase from the preceding year (53.8%). Both countries had an increase of more than 10 points compared to the preceding year, but recovery was still not at the 2019 level (U.S. 66.1%; Canada 77.1%). The pace of recovery in the U.S. has been slower than in 2010, immediately after the financial crisis in 2010 (U.S. 70.2%; Canada 65.2%), but recovery in Canada exceeded that of 2010.
- Looking at operating profits by industry, in the U.S., because of recovery and increase in demand, 80% or more of the companies in the food (83.9%), sales company/sales subsidiary (80.0%), and transport (80.0%) industries expect to be profitable, but because of decrease in demand due to restrictions on activities and suspension of operations at factories due to a shortage of semi-conductors, more than 50% of businesses in the following industries forecast a loss: travel/amusement (64.3%), automobiles etc. (54.5%), and automotive etc. parts (51.6%). In Canada, 80% or more of the companies in the food (100%), general machinery (87.5%), and iron/non-ferrous metals/fabricated metal products (83.3%) forecasted expect to be profitable, but 60% or more of the companies in the travel/amusement (75.0%) and mining/energy industries (60.0%) forecast a loss.
- Compared to the prior year, in 2021, more than half of the respondents in the U.S. forecasted an “increase” (51.6%) in their operating profit, a 34.8 points increase from the prior year’s 16.8%. Because of the restarting of economic activities and increased demand for housing, the percentage of respondents that forecasted “increase” in the retail (90.9%) and real estate/leasing industries (87.5%) were especially high. In Canada, the percentage of respondents forecasted an “increase” was a little less than 40% (39.4%), an increase of 25 points from the prior year (14.4%). By industry, 50% or more of transport (67.5%), sales company/sales subsidiary (52.4%), and general machinery (50.0%) forecasted an “increase.”
- Looking at the range in businesses forecasting increases and decreases in operating profits compared to the preceding year, in both the U.S. and Canada, more than 30% of the respondents expected “remain the same” (U.S. 31.5%, Canada (37.0%), and more than 20% of the respondents expected an “increase by 10-50%,” (U.S. 24.0%, Canada 22.8%). The DI Index (note) predicting business sentiment was 34.7 in the U.S. and 15.8 in Canada, a significant improvement from the preceding year for both countries (U.S. -42.0, Canada -39.7).
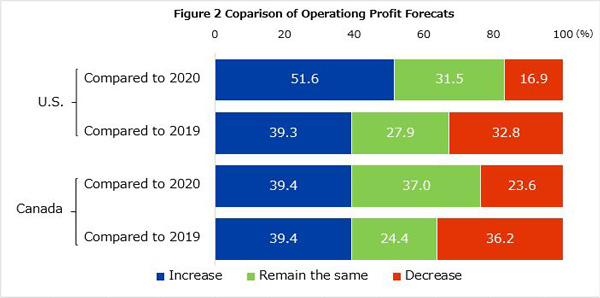
- Compared to 2019, before the spread of Covid-19, respondents expecting an “increase” in operating profit for 2021 was 39.3% in the U.S. By industry, more than 50% of the companies in food (61.3%) and electrical machinery/electronic devices (55.6%), which have done well even during the Covid-19 pandemic, expect an “increase.” On the other hand, the percentage of respondents that replied “decrease” was 32.8%, meaning operating profit forecasts for a little less than one-third of the companies have not returned to pre-Covid-19 levels. The DI index against 2019 was 6.5.
- In Canada, the percentage of companies that replied “increase” was 39.4%, the same as 2020. By industry, sales company/sales subsidiary (57.1%), transport (55.6%), and trading/wholesale (52.9%) exceeded 50%. On the other hand, the percentage of companies that replied “decrease” was 36.2%. For the travel/amusement (87.5%) and automotive etc. parts (72.7%), conditions continued to be difficult, with 70-90% expecting decrease. The DI index against 2019 was 3.2.
(Note) Short for Diffusion Index, this is the figure equal to the percentage of companies with an increased operating profit minus the percentage of companies with a decreased operating profit.
2. Future Business Expansion
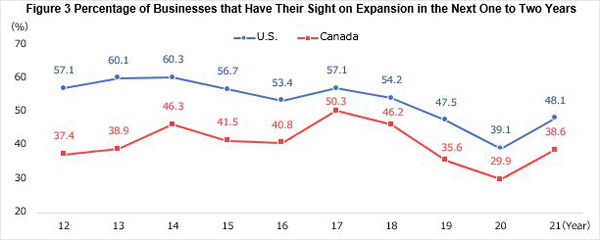
- The percentages of respondents that said they had their sights on business “expansion” in the next one or two years were 48.1% and 38.6% in the U.S. and Canada, respectively, with both countries surpassing pre-Covid-19 figures (47.5% and 35.6%, respectively). In the U.S., more than 70% of the companies in food (74.2%) and precision machines/medical equipment (70.0%) industries, and in Canada, more than 80% of the companies in the iron/non-ferrous metals/fabricated metal products (83.3%) industry had their sights on business expansion.
- The main reason given for expansion was “sales increase in local markets” for both countries (U.S. 89.6%, Canada 77.6%). The top answers that were given as specific functions that the respondents planned to expand in the U.S. and Canada were sales function (65.4% and 54.2%, respectively), high-value added products production (35.1% and 25.0%, respectively), and general-purpose products production (20.1% and 33.3%, respectively).
- With respect to business strategies, close to 30% of respondents in both countries (U.S. 27.3%, Canada 27.8%) said that they planned to reassess their sales strategy, reassessment of control/management systems was at the 20% level (25.1% and 21.4%, respectively), reassessment of procurement was about 20% (23.2% and 17.6%, respectively), and reassessment of production was at the 10% level (18.9% and 11.4%, respectively).
- When asked about reassessment of sales strategy, the most common answer in both countries was increasing selling prices at a little over 50% (U.S. 52.0%, Canada 51.4%). After that, in the U.S., change of sales destination (41.9%) and review of sales products (41.0%) came in second at more than 40%, while in Canada, promotion of digital tools (45.7%) and promoting use of virtual exhibitions (40.0%) came in second at 40% or more.
- In terms of the nature of the reassessment of procurement, many respondents said change of procurement source (U.S. 82.3%, Canada 86.4%) and implementation of multiple sourcing (U.S. 62.0%, Canada 59.1%). In the U.S., the top procurement sources to be changed were in the U.S. (43), Japan (40), and China (33), and the top procurement sources after the change were in the U.S. (45), ASEAN (16), and Mexico and other Asian/Oceana countries (12, respectively).
- When asked about reassessment of production, the most common answers in both countries were “increase in new investments/capital investments” (U.S. 59.0%, Canada 78.6%), “change of production sites” (U.S. 40.4%, Canada 42.9%), and “automation/labor conservation” (US 32.1%, Canada 50.0%). In the U.S., the top production sites to be changed were in the U.S. (30), Japan (8), and China (4), and the top production sites after the change were in the U.S. (11), Japan (11), and Mexico (9).
- When asked about reassessment of control/management systems, the most common answer in both countries was “expansion of the utilization of work from home and teleworking” (U.S. 59.7%, Canada 77.8%).
3. Supply Chain and Human Rights
- Regarding the issue of human rights in supply chains, 58.5% of the companies in the U.S. and 68.3% of the companies in Canada recognize it as a management challenge. There was a difference in the degree of recognition depending on the size of the business. In the U.S., the degree of recognition was 66.1% for large businesses (businesses with 100 or more employees), 11.8 points higher than the 54.3% for small and mediums sized businesses (businesses with less than 100 employees). In Canada as well, the degree of recognition was 8.3 points higher for large business (businesses with 50 or more employees, 72.1%) than small and mediums sized businesses (businesses with less than 50 employees, 63.8%).
- By industry, more than 70 to 80% of businesses in the automobiles etc. (81.6%), rubber/ceramic/stone and clay products (81.3%), electrical machinery parts/electronic device parts (75.0%), and transport (73.3%) industries recognized the issue. In Canada, 80% or more of trading/wholesale (88.2%) and food (80.0%) industries recognized the issue.
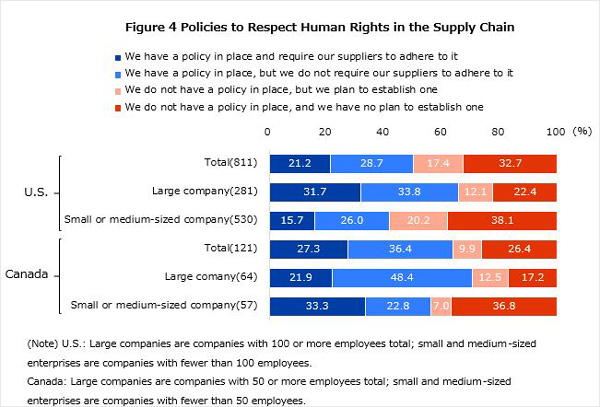
- A little less than half of the companies in the U.S. (49.9%) and more than 60% of the companies in Canada (63.7%) have policies on respecting human rights in the supply chain. Of those companies, more than 40% (U.S. 42.5%, Canada 42.9%) seek compliance with such policies by their procurement sources. In regard to the percentage of companies that have a policy to respect human rights and seek compliance with such policies by their procurement sources, 60-70% seek compliance by procurement sources in the host countries (U.S. 69.8%, Canada 65.6%), and more than 40% seek compliance by procurement sources in Japan (43.8% for both U.S. and Canada).
- On the other hand, the percentage of companies that were asked by customers to comply with policies concerning respect from human rights was about 30% for both countries (U.S. 34.0%, Canada 28.4%). The percentage of companies that were requested to comply with such policies by customers in host countries was a little over 20-30% (U.S. 31.0%, Canada 22.4%), and less than 10% by customers in Japan (U.S. 5.6%, Canada 6.9%).
4. Trade Agreement Utilization/Impact
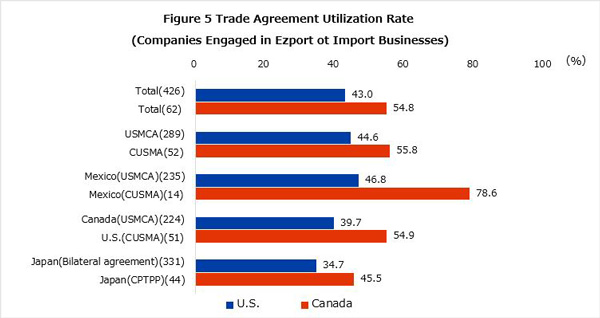
- The use rate of trade agreements of companies that responded was 36.1% for the U.S. and 51.5% for Canada. The utilization rates for USMCA (Canada: CUSMA; hereinafter the same) were 29.2% and 46.8%, respectively; that of the U.S.-Japan trade agreement was 28.0%, and that of CPTPP for trade between Canada and Japan was 37.7%. The USMCA utilization rate for trade with Mexico was close to 30% for both countries (U.S. 26.4%, Canada 27.5%). For trade between U.S. and Canada, Canada (45.2%) was higher than the U.S. (22.6%).
- The utilization rate of trade agreements of companies engaged in exports or imports was 43.0% for the U.S. and 54.8% for Canada. The utilization rates of USMCA were 44.6% and 55.8%, respectively; that of the U.S.-Japan trade agreement was 34.7%, and that of CPTPP for trade between Canada and Japan was 45.5%. Canada’s USMCA utilization rate for trade with Mexico was 78.6%, higher than the U.S.’s 46.8%. For trade between the U.S. and Canada, Canada (54.9%) was higher than the U.S. (39.7%).
5. Effect of Changes in the Trade Environment on Earnings
- When asked about effect from changes in the trade environment on their 2021 earnings, in the U.S., 32.9% said “Have no impact,” 29.0% said “Do not know,” and 26.2% said “Have a negative impact overall.” Compared to the prior year, “Do not know” increased by 13.1 points, but “Have a negative impact overall” decreased by 10.1 points. It appears that the reason for the increase in the answer of “Do not know” is due to the fact the trade policy announced by the Biden administration in March 2021 stated that policies that had been in in place will be reassessed, but the specific nature of the reassessment had not been specifically stated by the time the Survey was completed.
- In Canada, 40.7% said “Have no impact,” 31.4% said “Do not know,” and 16.9% said “Have a negative impact overall.” Compared to the preceding year, “Do not know” increased by 8.0 points while “Have no impact” decreased by 8.9 points.
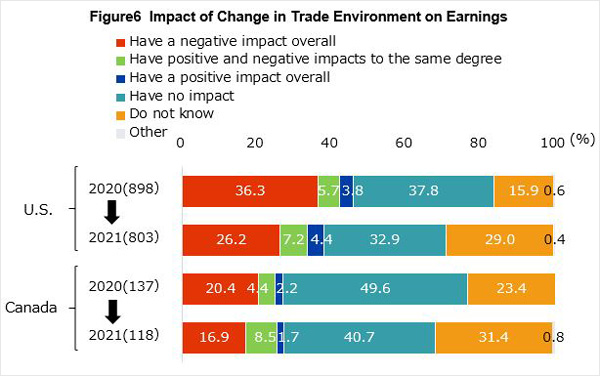
- When asked to name specifically government policies with the most negative impact, “additional tariffs under Section 301 of the Trade Act” (U.S. 55.2%, Canada 35.0%), “China’s retaliatory tariffs against the U.S.” (32.0% and 55.0%, respectively), and “additional tariffs of the U.S. imposed on steel and aluminum” (24.1%, 35.0%, respectively) were the top answers.
6. Management Challenges
- When asked about management challenges amidst restrictions on business activities due to Covid-19, “slow development of new customers” was the top answer for both the U.S. (62.0%) and Canada (51.6%), followed by “increase in wages of employees” (57.9%) and “rising logistics costs” (53.3%) in the U.S., and “rising logistics costs” (50.0%) and “rising procurement costs” (46.9%) in Canada; many companies also cited challenges in hiring/labor, and raw materials/parts procurement.
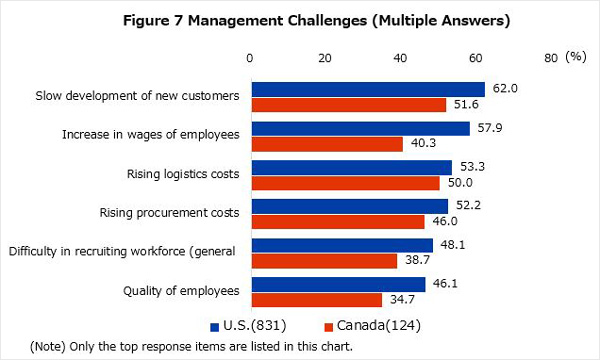
- When asked about countermeasures they were taking to handle management challenges, the most common answer was “differentiation from competing products” in both the U.S. (47.5%) and Canada (49.2%), followed by “increasing wages” (46.7%) and “reviewing suppliers of materials/parts and procured contents“ (43.3%) in the U.S., and “responding to various rules” (44.9%) and “introducing remote work and web conferences” (44.1%) in Canada.
7. Digital
- 47.6% and 52.0% of the companies in the U.S. and Canada, respectively, said they already used digital technology. When asked about the advantages of using digital technology, the top answers in both the U.S. and Canada were “stabilization/enhancement of quality of products/services” (55.9% and 47.7%, respectively), and “ability to address the issues of increasing wages/labor shortages” (49.4% and 46.6%, respectively).
- When asked about the technology being used, many companies in both the U.S. and Canada answered “EC” (59.1%, 58.6%), “data accumulation and/or management platform” (37.2%, 41.4%), “robots” (32.2%, 22.4%). When asked about the technology they were considering using, the top answers were “artificial intelligence (AI)” (38.3%, 32.7%), “data accumulation and/or management platform” (36.6%, 51.0%), and “IoT” (30.0%, 32.7%).
8. Addressing Environmental Issues
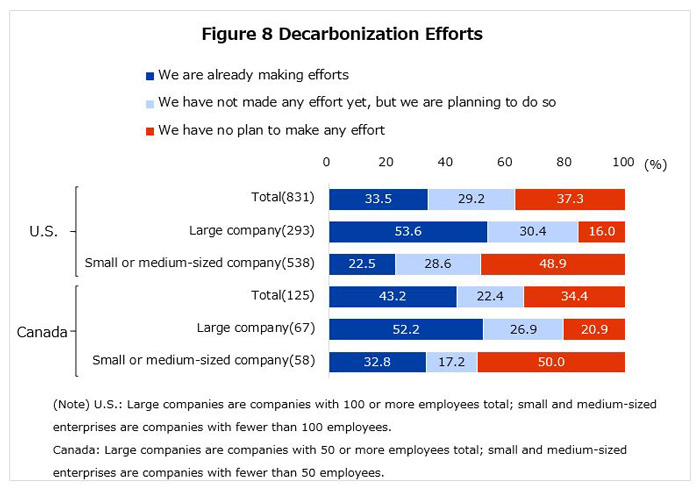
- 33.5% of the companies in the U.S. and 43.2% of the companies in Canada were engaged in decarbonization. Looking at the answers by the size of the companies, more than half of the large companies in both the U.S. (53.6%) and Canada (52.2%) answered they were engaged in decarbonization. Looking at the answers by industry, in the U.S., more than 60% of the companies in automobiles etc. (63.5%), more than 50% of the companies in rubber/ceramic/stone and clay products (56.3%) and electrical machinery/electronic devices (51.4%) were engaged in decarbonization; in Canada, 100% of the companies in food industry and 66.7% of the companies in iron/non-ferrous metals/fabricated metal products were engaged in decarbonization.
- As for the reasons for engaging in decarbonization, the top answer at close to 70% in both the U.S. and Canada was “instructions/recommendations from the headquarters (parent company)” (U.S. 68.2%, Canada 66.7%), followed by “regulations and/or preferential treatments set by central/local governments in the country/region of our operation” (30.2% and 42.0%, respectively).
- As for the nature of decarbonization, the most common answers were “conservation of energy/resources” (U.S. 66.1%, Canada 58.0%) and “development of new environment-friendly products” (37.5% and 33.3%, respectively). When asked about challenges to decarbonization, human resources/capacity shortages and costs increases were some of the answers.
9. Biden Administration Policies
- When asked about the effect of the Biden administration’s policies on business activities, 38.4% of the respondents said “Do not know,” 22.3% said “Have no impact,” 14.1% said “Have a negative impact overall,” and 13.6% said “Have a positive effect overall.” The reason “Do not know” is high is that a tax increase was one of President Biden’s promises, but Congress has not passed it due to opposition by the Republican Party.
- Looking at the answers by industry, the percentage of companies that answered that the policies would have a negative impact was high in businesses in automobiles etc. (36.4%) and rubber/ceramic/stone and clay products (26.7%). The Biden administration’s move toward electric vehicles is believed to be the reason for such answers. The percentages of the companies that answered that there were positive effects were high in the precision machines/medical equipment and professional and technical services (both 26.3%) industries.
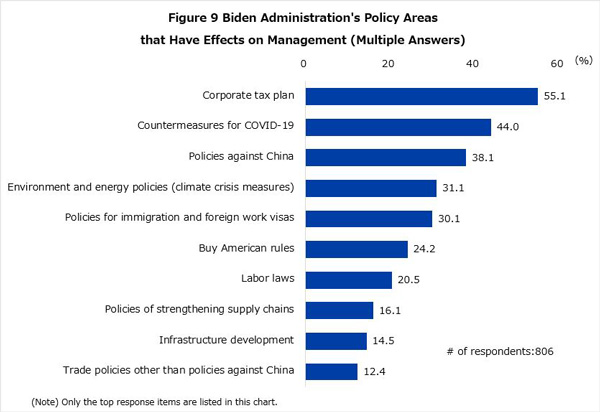
- When asked about policy areas of the Biden administration that have an impact on business, 55.1% said “corporate tax plan,” 44.0% said “countermeasures for Covid-19,” 38.1% said “policies against China,” 31.1% said “environmental/energy policies (climate crisis measures),” and 30.1% said “policies for immigration and foreign work visas.”
-
Japan External Trade Organization (JETRO) Americas Division, Overseas Department
(Representatives: Takashi Nakamizo, Mako Otsuka and Shinichiro Takimoto)
Tel: +81-3-3582-5545