


JETRO Invest Japan Report 2017 (Summary) 1. Solid Growth in Japan’s Inward FDI
End of 2016 sees new record for Japan’s inward FDI stock at 27.8 trillion yen
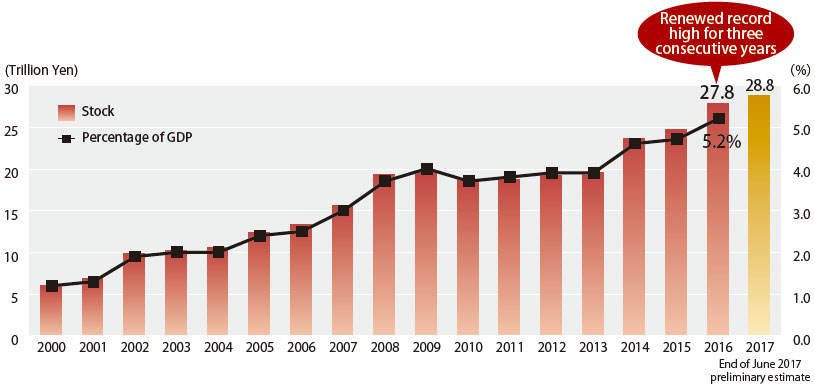
- Japan’s inward FDI stock at the end of 2016 was 27.8 trillion yen (a growth of 3.07 trillion yen from the FDI stock at the end of 2015) and reached a record high for the third consecutive year.
- The ratio against its nominal GDP was 5.2% in 2016, exceeding the 5% mark for the first time.
- The preliminary estimate of the FDI stock at the end of June 2017 is 28.8 trillion yen (announced by MOF in Sep. 2017).
The stock of inward FDI and its portion in the nominal GDP (based on BPM6)
[Source] "International Investment Position of Japan" (Ministry of Finance), "National Accounts of Japan" (Japan Cabinet Office)
Rapid increase in Asia’s share of inward FDI
- By region, Europe has the largest direct investment stock in Japan at 13.6 trillion yen (48.7%) followed by North America (7.2 trillion yen, 25.9%) and Asia (5.0 trillion yen, 18.0%).
- Inward FDI stock from Asia, the fastest growing investor region, has increased to 10 times above 2000 levels.
Share of inward FDI stock in Japan by region (as of the end of 2016)

[Source] “International Investment Position of Japan” (Ministry of Finance)
Inward FDI stock in Japan by country and region (as of the end of 2016) TOP 10
| Rank | Country/region | Stock (billion yen) | Ratio (%) |
|---|---|---|---|
| 1 | US | 7,010 | 25.2 |
| 2 | Netherlands | 3,800 | 13.6 |
| 3 | France | 3,351 | 12.0 |
| 4 | UK | 2,262 | 8.1 |
| 5 | Singapore | 2,210 | 7.9 |
| 6 | Switzerland | 1,294 | 4.6 |
| 7 | Cayman Islands | 1,199 | 4.3 |
| 8 | Hong Kong | 1,099 | 3.9 |
| 9 | Luxembourg | 868 | 3.1 |
| 10 | Germany | 850 | 3.1 |
Changes in inward FDI stock in Japan by region (growth ratio with the stock for year 2000 set to 100)
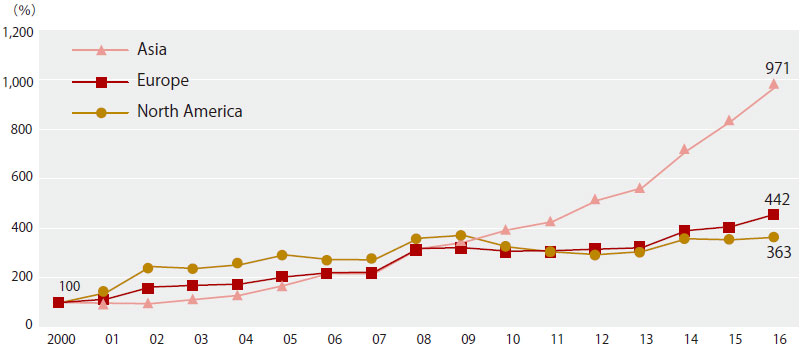
[Note] The stocks for 2014 and after are calculated based on BPM6. The stocks before 2013 were recalculated from being BPM5-based to BPM6-based by JETRO.
[Source] “International Investment Position of Japan” (Ministry of Finance)
The net inflow of Japan’s inward FDI in 2016 marked 3.8 trillion yen, a record high
- The net inflow of Japan’s inward FDI in 2016 marked 3.8 trillion yen (about six times that of the previous year), a record high since 1996 when comparisons could be made.
- By region, the flow was 2.0 trillion yen from Europe, 903.7 billion yen from Asia and 629.8 billion yen from North America. Inflow exceeded outflow for all three regions.
- The net inflow of inward FDI in Japan in January to September term of 2017 (provisional) was down from a year earlier but maintained a positive inflow of 1.24 trillion yen.
Changes in the flow (net) of inward FDI into Japan by country/region(Billion yen) (-: no data is available)
| Country/region | 2014 | 2015 | 2016 | 2017 Jan-Sep | |
|---|---|---|---|---|---|
| Provisional | Year-on-year growth(%) | ||||
| Asia | 678.2 | 673.7 | 903.7 | 524.7 | -39.9 |
| China | 80.2 | 77.8 | -15.1 | 64.7 | 34.5 |
| Hong Kong | 227.9 | 117.8 | 145.8 | -35.4 | - |
| Taiwan | 126.4 | 87.6 | 258.9 | 56.5 | -77.2 |
| Korea | 69.9 | 114.0 | 61.2 | 71.3 | 55.0 |
| ASEAN | 173.6 | 274.8 | 453.9 | 367.3 | -9.2 |
| Singapore | 144.0 | 222.9 | 383.0 | 389.5 | 23.4 |
| North America | 758.6 | 629.7 | 629.8 | 440.1 | -18.0 |
| US | 757.6 | 631.2 | 632.3 | 450.0 | -16.1 |
| Latin America | 72.9 | -248.4 | 180.8 | 159.4 | 6.8 |
| Oceania | 61.8 | -75.9 | 90.8 | -2.0 | - |
| Europe | 440.9 | -339.0 | 2,012.7 | 111.1 | -92.9 |
| EU | 375.8 | -314.5 | 1,896.3 | 57.9 | -96.1 |
| World | 2,074.5 | 667.5 | 3,830.7 | 1,237.0 | -61.4 |
Changes in the quarterly flow (net) of inward FDI into Japan

[Note] Q1 (Jan. - Mar.), Q2 (Apr. - Jun.), Q3 (Jul. - Sep.), Q4 (Oct. - Dec.)
[Source] "Balance of Payments" (Ministry of Finance)
Acquisition of the management rights of Kansai International Airport and Osaka International Airport was the largest M&A in Japan
- Major inward M&A deals in 2016 include the acquisition of management rights of the Kansai International Airport and Osaka International Airport by a consortium led by VINCI Airports of France and ORIX (2.2 trillion yen), and the acquisition of Sharp by Hon Hai Precision Industry of Taiwan.
- In addition, Chinese home appliance manufacturer Midea Group acquired a share of Toshiba Lifestyle, a company manufacturing and selling home appliances under the umbrella of Toshiba. There were also large acquisition deals by European pharmaceutical companies.
Major inward M&A deals in Japan (2016 to the first half of 2017)(-: no data is available)
| Date effective | Target | Industry | Acquirer | Parent country/region | Industry | Value (Billion yen) |
|---|---|---|---|---|---|---|
| 2016 Apr. | New Kansai Intl-Op Concession | Transportation & infrastructure | An SPV formed by ORIX-VINCI Airports consortium | - | Transportation & infrastructure | 2205.0 |
| 2016 Aug. | Sharp | Electronics | Hon Hai Precision Industry | Taiwan | Electronics | 388.8 |
| 2016 Feb. | One M Logistics 2 | Real Estate | LaSalle LOGIPORT REIT | US | Real estate investment trust | 161.4 |
| 2016 Apr. | Astellas Pharma-Dermatology | Pharmaceuticals | LEO Pharma | Denmark | Pharmaceutical | 89.1 (675 million euros) |
| 2016 May | Takeda Pharm-Respiratory | Pharmaceuticals | AstraZeneca | UK | Pharmaceutical | 69.9 (575 million USD) |
| 2016 Jun. | Toshiba Lifestyle Products & Services | Consumer electronics | Midea International | China | Consumer electronics | 51.4 |
| 2017 May | Calsonic Kansei | Autoparts | Kohlberg Kravis Roberts (KKR) | US | Investment firm | 498.2 |
| 2017 Apr. | USJ | Leisure | Comcast NBC Universal | US | Media | 254.8 |
| 2017 Mar. | Accordia Golf | Leisure | MBK Partners | Korea | Investment firm | 149.0 |
| 2017 Jul. | Hitachi Koki | Machinery | Kohlberg Kravis Roberts (KKR) | US | Investment firm | 79.3 |
2017

-
1. Solid Growth in Japan’s Inward FDI
 (1.8MB)
-
2. Toward Improvement of Business Environment
(1.0MB)
-
3. New Trend in Inward FDI in Japan – Age of the Fourth Industrial Revolution – Contributing to Solving Problems Japan Faces and Expanding Overseas Markets for Japanese Companies
(1.1MB)
-
4. Perception of the Business Environment in Japan among Foreign-affiliated Companies
(1.8MB)
-
5. Foreign Investment for Revitalization of Local Economy – Attract Foreign-affiliated Companies Taking Advantage of Regional Characteristics
(1.6MB)
-
6. Investment Promotion Activities of JETRO
(3.5MB)
Contact Us
Investing in Japan
We will do our very best to support your business expansion into and within Japan. Please feel free to contact us via the form below for any inquiries.
Inquiry FormJETRO Worldwide
Our network covers over 50 countries worldwide. You can contact us at one of our local offices near you for consultation.
Worldwide Offices